|

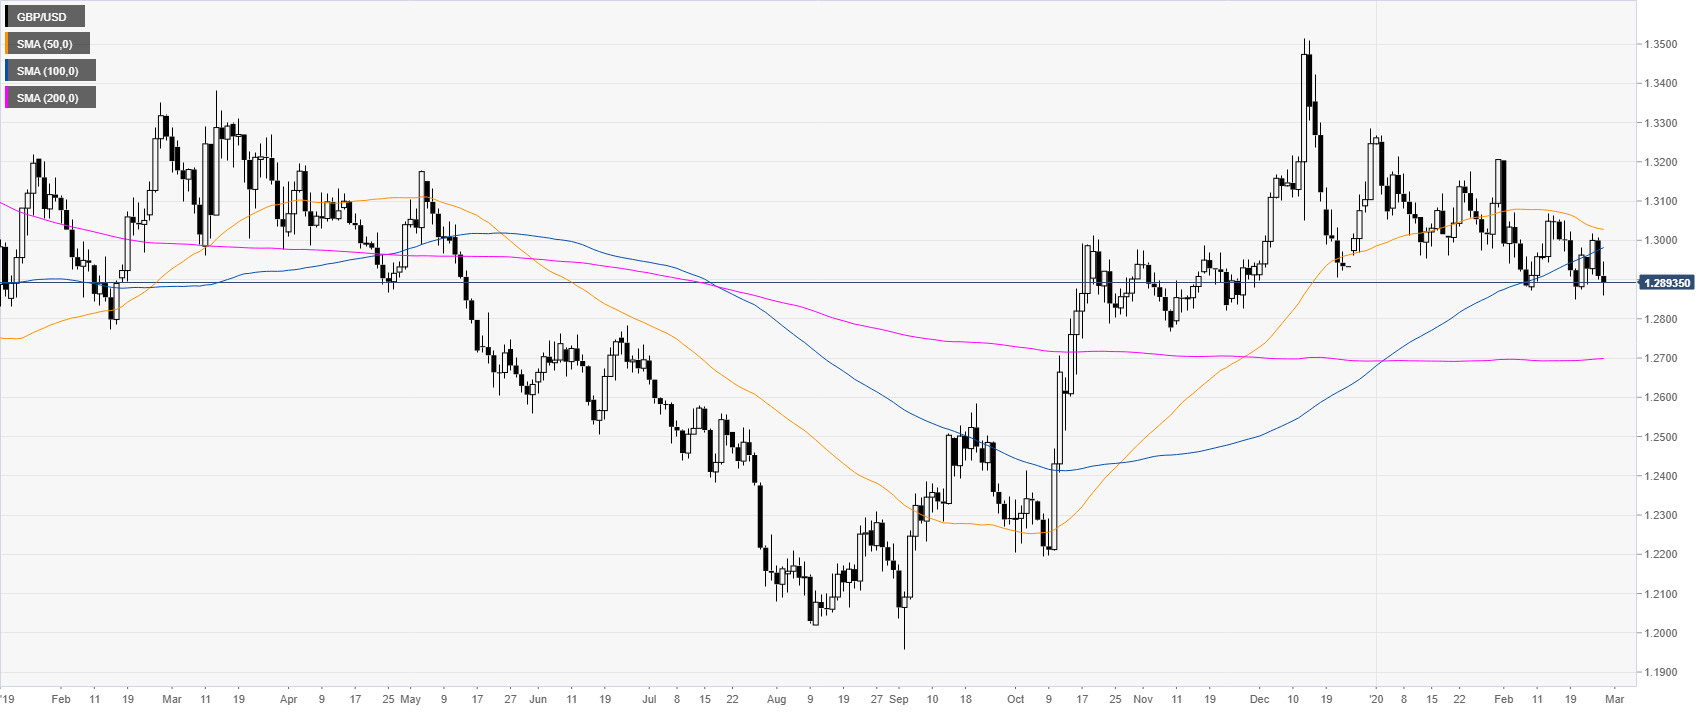
GBP/USD Price Analysis: Pound hovering near multi-month lows, sub-1.2900 figure

  • GBP/USD is consolidating losses after hitting levels not seen since November 2019.
  • The level to beat for bears is the 1.2861 support.
 

GBP/USD daily chart 

 
After the October and December bull-market, GBP/USD is trading in a rectangle consolidation above the 200-day simple moving averages (SMAs).
 

GBP/USD four-hour chart

 
Pound/Dollar is consolidating losses after reaching levels not seen since November 2019. The currency pair remains relatively weak, especially on a break below the 1.2861 support. Downside targets can be seen near the 1.2835 and 1.2731 levels. On the flip side, bullish attempts might find resistance near the 1.2941, 1.2981 and 1.3000 levels, according to the Technical Confluences Indicator.
 
 
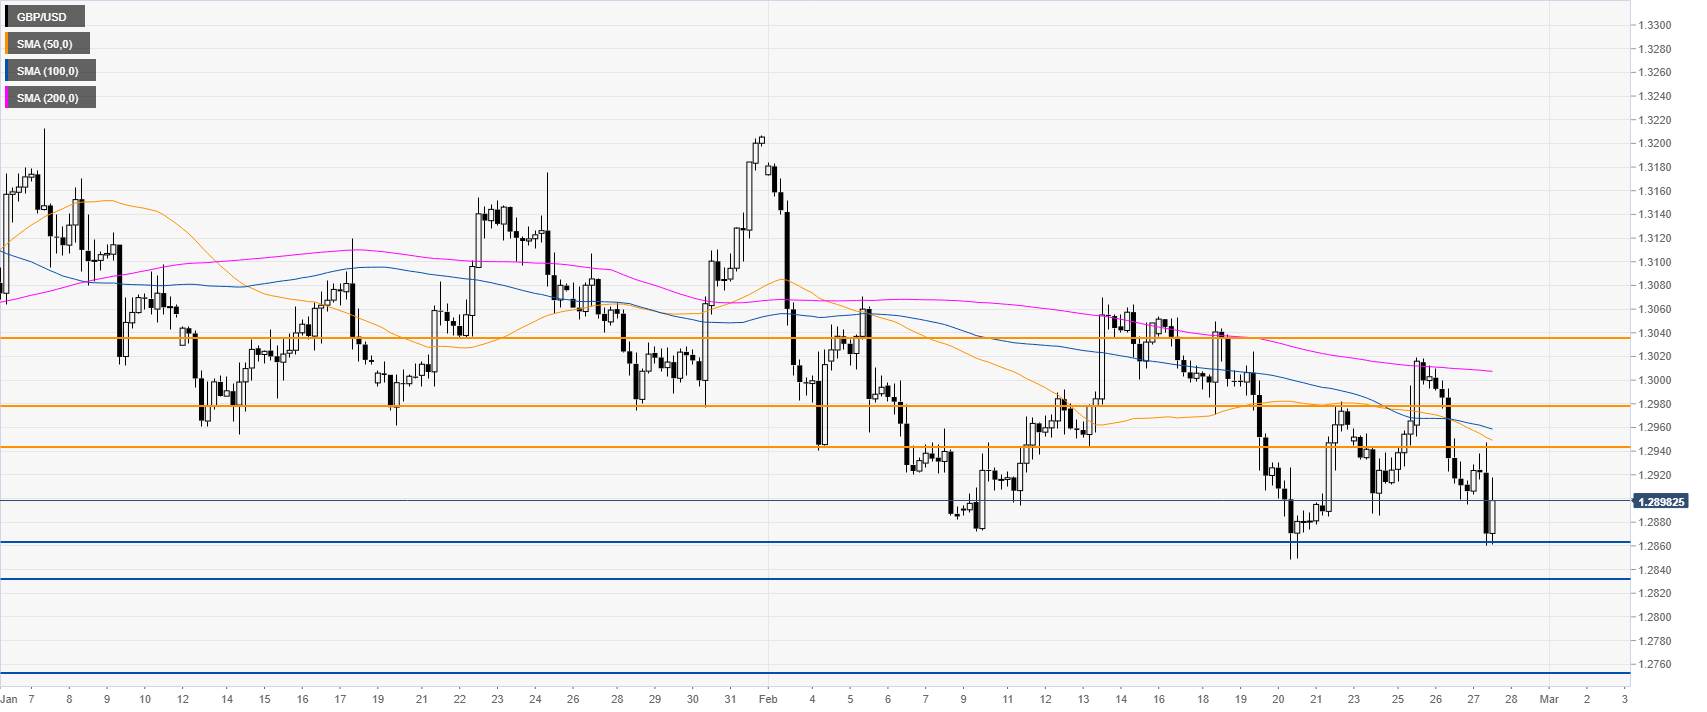
Resistance: 1.2941, 1.2981, 1.3000
Support: 1.2861, 1.2835, 1.2731


Additional key levels

GBP/USD

Overview
Today last price1.2893
Today Daily Change-0.0016
Today Daily Change %-0.12
Today daily open1.2909
 
Trends
Daily SMA201.2983
Daily SMA501.303
Daily SMA1001.2982
Daily SMA2001.2699
 
Levels
Previous Daily High1.3008
Previous Daily Low1.29
Previous Weekly High1.3054
Previous Weekly Low1.2849
Previous Monthly High1.3281
Previous Monthly Low1.2954
Daily Fibonacci 38.2%1.2941
Daily Fibonacci 61.8%1.2967
Daily Pivot Point S11.287
Daily Pivot Point S21.283
Daily Pivot Point S31.2761
Daily Pivot Point R11.2978
Daily Pivot Point R21.3047
Daily Pivot Point R31.3087

Author

Flavio Tosti

Flavio Tosti

Independent Analyst


More from Flavio Tosti
Share:

Editor's Picks

EUR/USD flat lines near 1.1800 as traders brace for US PPI release

The EUR/USD pair trades on a flat note near 1.1800 during the early Asian session on Friday. The pair steadies as softer Eurozone inflation offsets US tariff uncertainties. Traders await the preliminary reading of the Consumer Price Index from Germany on Friday for more clues about the pace of future policy easing. On the US front, the Producer Price Index report will be released. 

GBP/USD threatens the 200-day SMA near 1.3440

GBP/USD rapidly leaves behind Wednesday’s strong advance, coming under heavy pressure and retesting the 1.3440 zone, where the critical 200-day SMA is located. Cable’s deep pullback follows the strong gains in the Greenback, while investors continue to pencil in a potential BoE rate cut in March.

Gold awaits acceptance above $5,200 and US PPI data

Gold consolidates previous rebound near $5,200 amid risk-off markets, awaiting US PPI release. The US Dollar eyes a flattish weekly close as dovish Fed outlook and tariff woes outweigh geopolitical risks. Gold yearns for acceptance above $5,200 to resume the uptrend, with a bullish RSI in play.

Top Crypto Gainers: Stable and Decred rally, Pippin approaches record highs

Altcoins, such as Stable, Decred, and Pippin, are extending gains so far this week, defying the risk-averse conditions in the broader cryptocurrency market. Stable and Pippin are near record high levels, while Decred extends its breakout rally above $30.

Changing the game: International implications of recent tariff developments

The Supreme Court ruling on International Emergency Economic Powers Act (IEEPA) tariffs provides limited relief for the rest of the world, with weighted average tariff rates modestly lower.

Bitcoin steadies as traders eye US–Iran talks

Bitcoin (BTC) price is stabilizing around $68,000 at the time of writing on Thursday after a 6.2% relief rally the previous day amid a broader downward trend.