|
GBP/USD price analysis: Pound corrects down after stellar US Nonfarm Payrolls
- The Nonfarm Payrolls surprised to the upside with 266k vs. 180k forecast.
- The cable is correcting down and challenging the 1.3122 level.

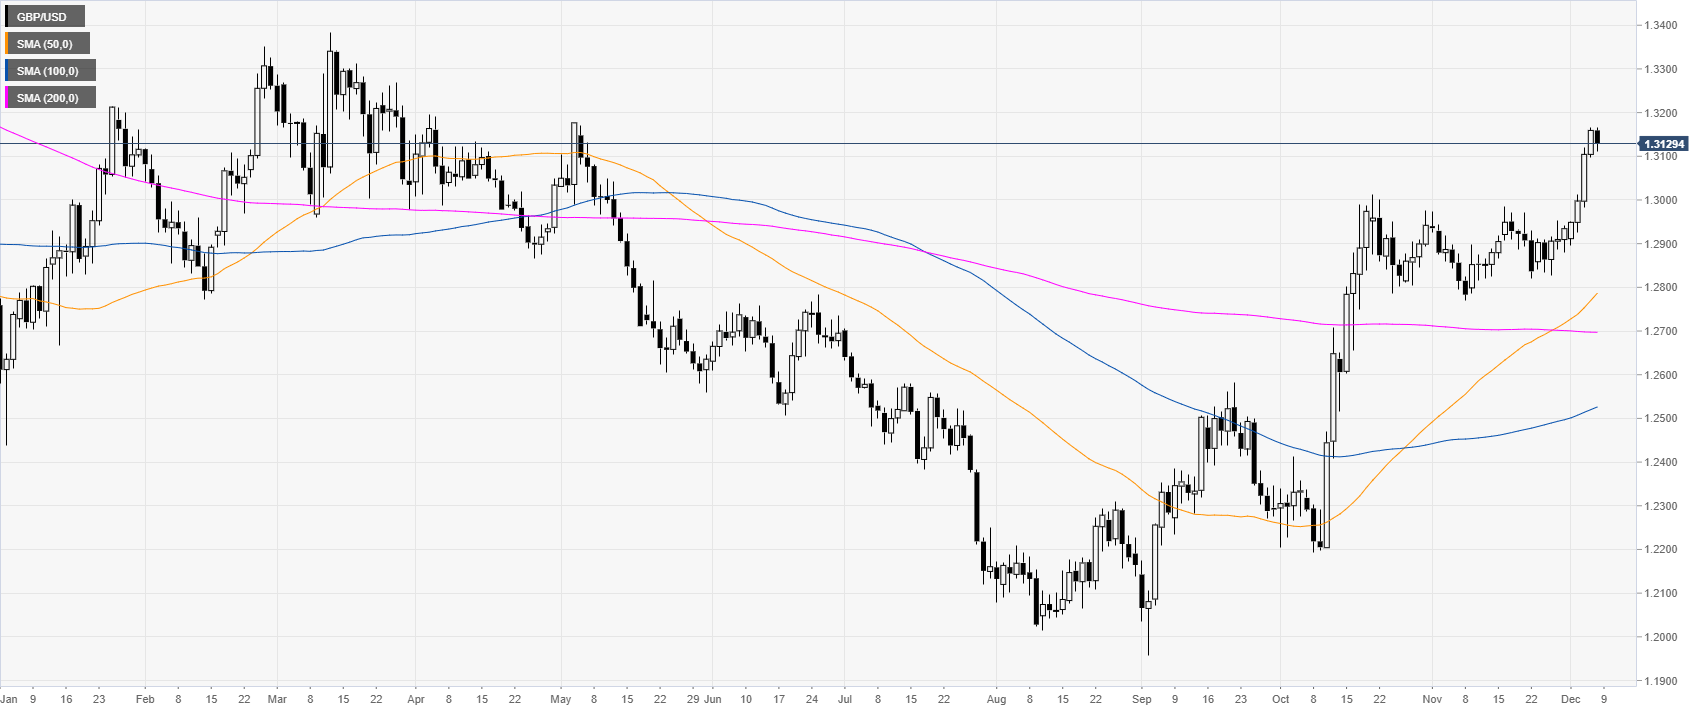
GBP/USD daily chart
Following November’s consolidation, the spot eventually broke to the upside hitting levels not seen since early May of this year. In the New York session, the Nonfarm Payrolls smashed market expectations with 266k vs. 180k forecast.
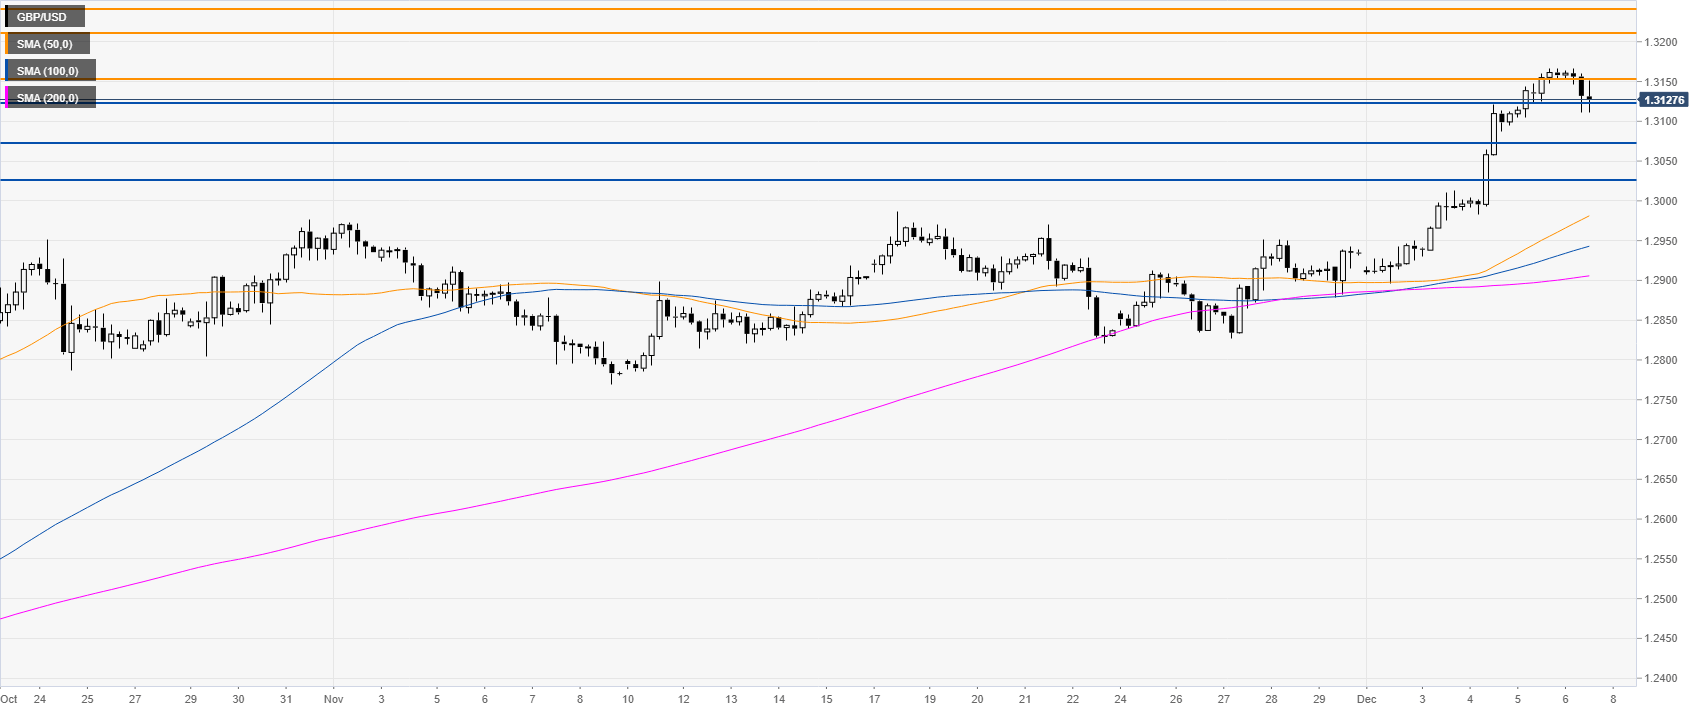
GBP/USD four-hour chart
After a sharp run-up, the market is correcting down as GBP/USD is testing the 1.3122 support. If bears break this level, the spot could continue the correction towards the 1.3074 and 1.3026 price levels, according to the Technical Confluences Indicator.
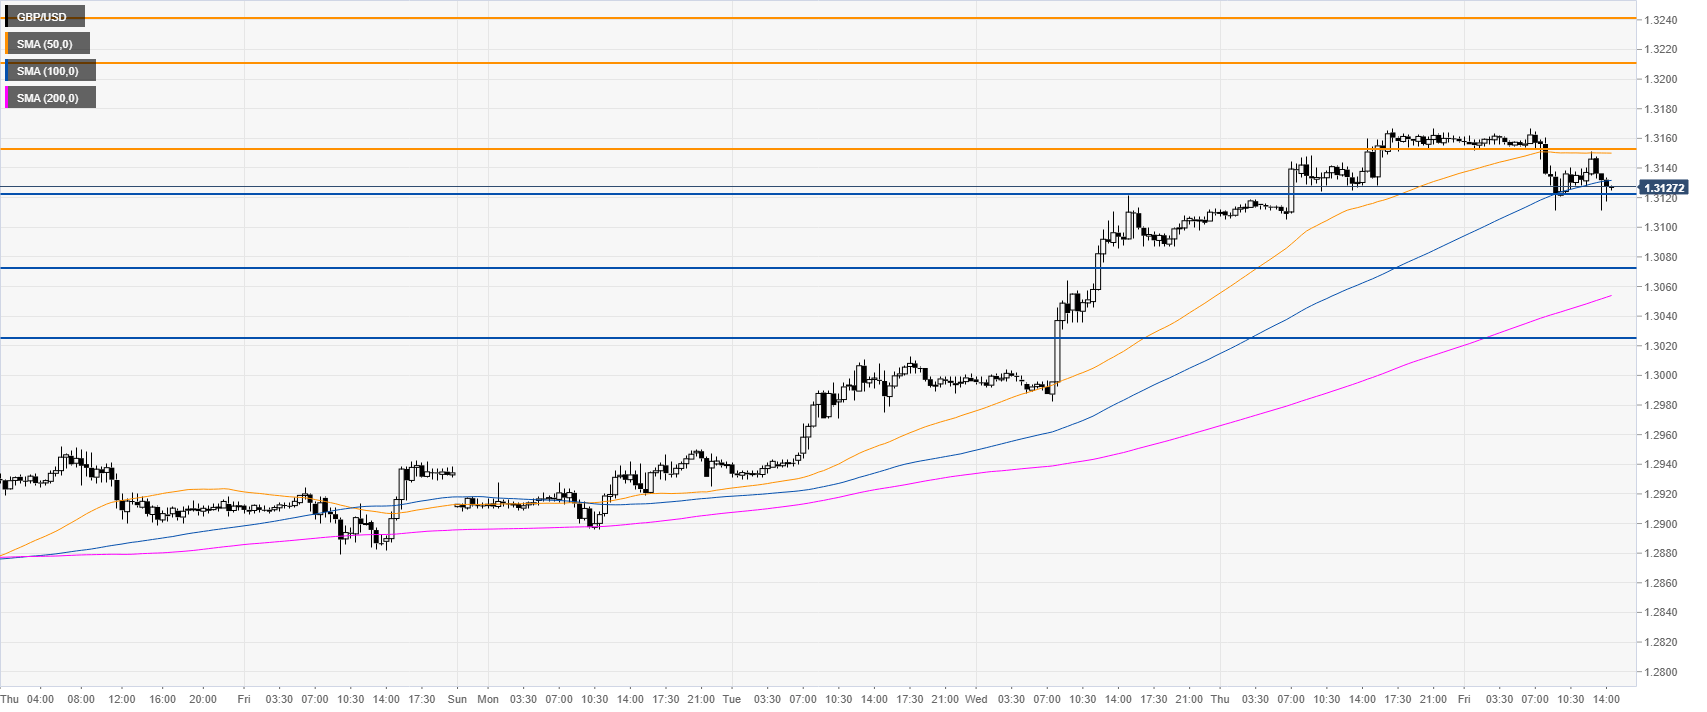
GBP/USD 30-minute chart
The market is challenging the 100 SMA. Bulls would need to reclaim the 1.3150 level to attract further buying and a potential run towards the 1.3211 and 1.3243 levels.
Additional key levels
Author

Flavio Tosti
Independent Analyst
More from Flavio Tosti


