GBP/USD Price Analysis: Pauses the post-BoE rally near mid-1.2700s ahead of US NFP
- GBP/USD is seen consolidating the Thursday's post-BoE recovery from over a two-week low.
- The technical setup seems tilted in favour of bulls and supports prospects for additional gains.
- Bulls, however, seem reluctant and prefer to wait for the release of the crucial US NFP report.

The GBP/USD pair struggles to capitalize on the previous day's solid recovery of around 130 pips from the 1.2625 area, or over a two-week low and oscillates in a narrow band during the Asian session on Friday. Spot prices currently trade near mid-1.2700s, closer to the weekly peak, as traders look to the US monthly jobs report before placing fresh bets.
Heading into the key data risk, the British Pound (GBP) continues to draw support from a slightly more hawkish stance adopted by the Bank of England (BoE) on Thursday. In fact, BoE Governor Andrew Bailey said that we need to see more evidence that inflation is set to fall all the way to the 2% target and stay there before rates can be lowered. Meanwhile, expectations for an imminent shift in the Federal Reserve’s (Fed) policy stance keep the US Dollar (USD) bulls on the defensive near the weekly low and further act as a tailwind for the GBP/USD pair.
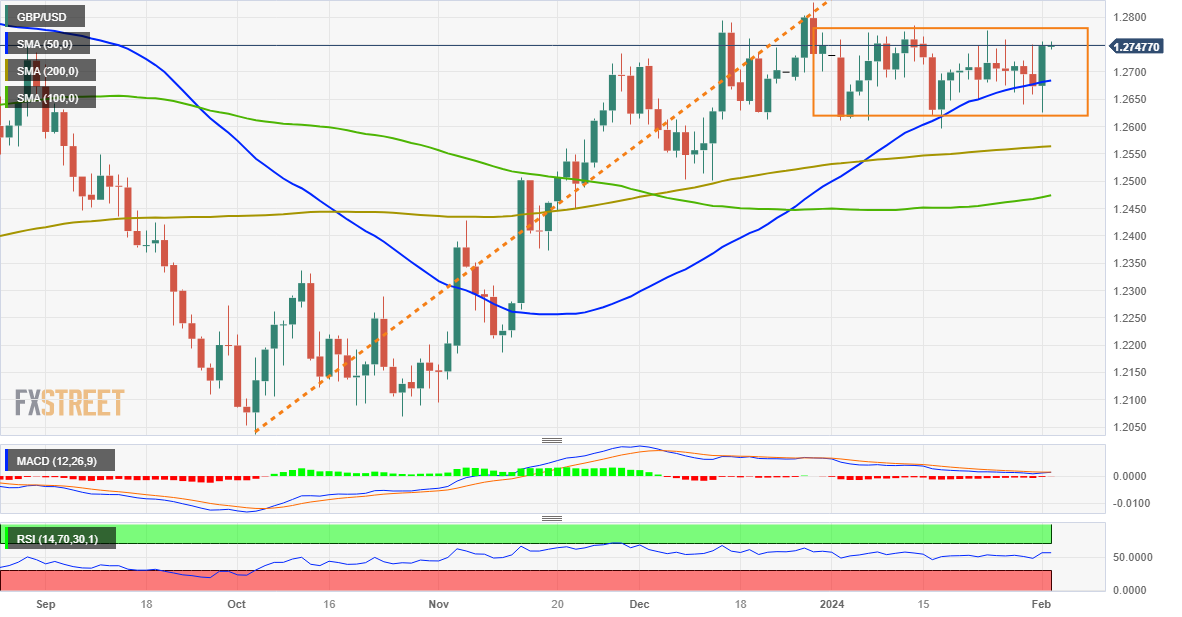
From a technical perspective, the range-bound price action witnessed since the beginning of this year points to indecision among traders over the next leg of a directional move. This, however, might still be categorized as a bullish consolidation phase on the back of a strong rally from the October 2023 swing low. Furthermore, oscillators on the daily chart are holding in the positive territory and are still far from being in the overbought zone, validating the constructive outlook and supporting prospects for a further near-term appreciating move for the GBP/USD pair.
Some follow-through buying beyond the 1.2770-1.2780 horizontal resistance will reaffirm the positive bias and lift spot prices beyond the 1.2800 mark, towards the 1.2825-1.2830 area, or a multi-month peak touched in December. The subsequent move up has the potential to lift the GBP/USD pair towards reclaiming the 1.2900 mark. The momentum could extend further towards the 1.2940-1.2945 region en route to the 1.3000 psychological mark.
On the flip side, any corrective pullback now seems to find some support near the 1.2700 mark ahead of the 1.2625 region or a multi-week low touched on Thursday, and the 1.2600 round figure. A convincing break below the latter would expose the very important 200-day Simple Moving Average (SMA), currently pegged near the 1.2560 area. The said area should act as a key pivotal point, which if broken decisively might shift the near-term bias in favour of bearish traders and prompt aggressive technical selling around the GBP/USD pair.
GBP/USD daily chart
Technical levels to watch
Author

Haresh Menghani
FXStreet
Haresh Menghani is a detail-oriented professional with 10+ years of extensive experience in analysing the global financial markets.


