|

GBP/USD Price Analysis: More downside looks inevitable on Double Top breakdown near 1.1850

  • GBP/USD has taken a sigh of relief after a nosedive move near 1.1825, more downside looks inevitable.
  • Fed Powell’s extremely hawkish remarks on interest rate guidance have spooked market sentiment.
  • A breakdown of crucial support after a Double Top formation has confirmed a bearish reversal.

The GBP/USD pair has turned sideways around 1.1825 in the early Asian session after a nosedive move from the psychological resistance of 1.2000. The downside bias in the Cable looks not over yet as the currencies have to bear the volatility associated with the US Automatic Data Processing (ADP) Employment Change (Feb) after sheer volatility inspired by the commentary from Federal Reserve (Fed) chair Jerome Powell.

S&P500 futures were heavily dumped by investors as more rates from the Federal Reserve (Fed) have made the US economy prone to recession. A dismal US economic outlook sent the US Dollar Index (DXY) to a fresh three-month high at 105.65. The return delivered on 10-year US Treasury bonds is around 3.97%.

The remarks from Fed Powell in his testimony before Congress forced investors to underpin the risk aversion theme. Powell said the “ultimate level of interest rates is likely to be higher than previously anticipated,” after the “latest economic data have come in stronger than expected.”

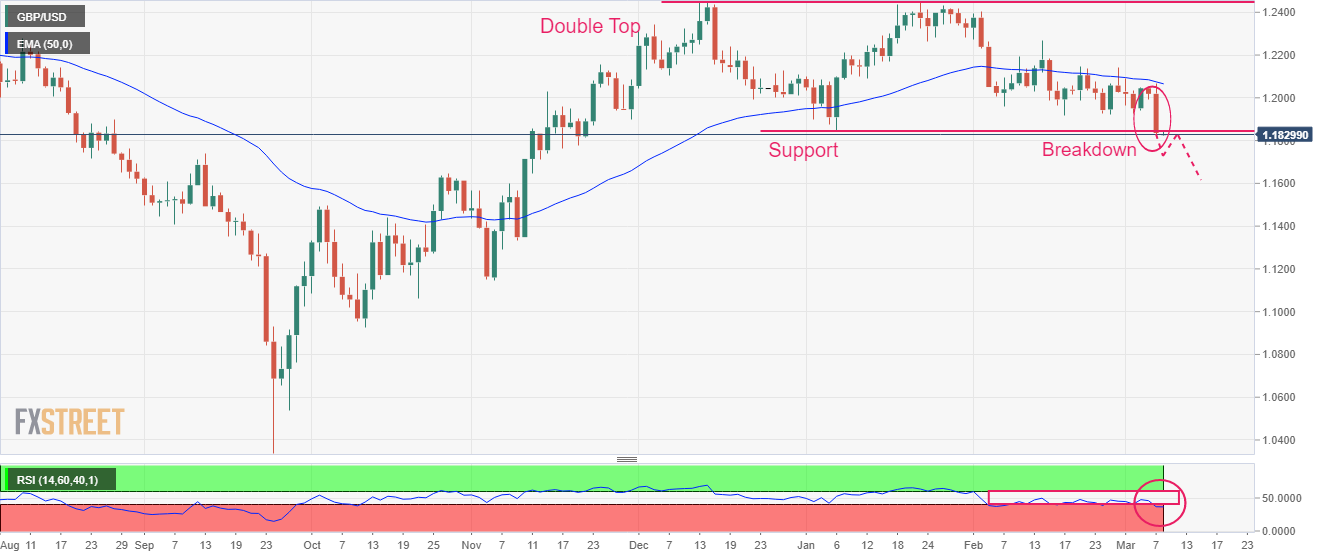
GBP/USD has delivered a breakdown of the Double Top chart pattern formed on a daily scale plotted from December 15 high at 1.2447. A slippage below the horizontal support placed from January 06 low at 1.1841 confirms a bearish reversal.

The 50-period Exponential Moving Average (EMA) at 1.2064 is acting as a major barricade for the Pound Sterling.

Meanwhile, the Relative Strength Index (RSI) (14) has slipped below 40.00 for the first time in the past one month. More downside looks inevitable as the RSI (14) is not showing any sign of divergence and oversold.

Should the Cable break below the round-level support of 1.1800, US Dollar bulls will drag the asset further toward November 17 low at 1.17633 followed by November 14 low around 1.1700.

On the flip side, a move above February 24 high at 1.2040 will drive the asset toward February 23 high around 1.2080. A breach of the latter will expose the asset to February 21 high around 1.2140.

GBP/USD daily chart

GBP/USD

Overview
Today last price1.1834
Today Daily Change-0.0185
Today Daily Change %-1.54
Today daily open1.2019
 
Trends
Daily SMA201.2047
Daily SMA501.214
Daily SMA1001.1992
Daily SMA2001.1913
 
Levels
Previous Daily High1.2049
Previous Daily Low1.1993
Previous Weekly High1.2143
Previous Weekly Low1.1922
Previous Monthly High1.2402
Previous Monthly Low1.1915
Daily Fibonacci 38.2%1.2014
Daily Fibonacci 61.8%1.2028
Daily Pivot Point S11.1992
Daily Pivot Point S21.1964
Daily Pivot Point S31.1936
Daily Pivot Point R11.2047
Daily Pivot Point R21.2076
Daily Pivot Point R31.2103

Author

Sagar Dua

Sagar Dua

FXStreet

Sagar Dua is associated with the financial markets from his college days. Along with pursuing post-graduation in Commerce in 2014, he started his markets training with chart analysis.

More from Sagar Dua
Share:

Markets move fast. We move first.

Orange Juice Newsletter brings you expert driven insights - not headlines. Every day on your inbox.

By subscribing you agree to our Terms and conditions.

Editor's Picks

EUR/USD retreats below 1.1750 on modest USD recovery

EUR/USD stays under modest bearish pressure and trades below 1.1750 on Friday. Although trading conditions remain thin following the New Year holiday and ahead of the weekend, the modest recovery seen in the US Dollar causes the pair to edge lower. The economic calendar will not feature any high-impact data releases.

GBP/USD struggles to gain traction, stabilizes above 1.3450

After testing 1.3400 on the last day of 2025, GBP/USD managed to stage a rebound. Nevertheless, the pair finds it difficult to gather momentum and moves sideways above 1.3450 as market participants remain in holiday mood.

Gold climbs toward $4,400 following deep correction

Gold reverses its direction and advances toward $4,400 after suffering heavy losses amid profit-taking before the New Year holiday. Growing expectations for a dovish Fed policy and persistent geopolitical risks seem to be helping XAU/USD stretch higher.

Cardano gains early New Year momentum, bulls target falling wedge breakout

Cardano kicks off the New Year on a positive note and is extending gains, trading above $0.36 at the time of writing on Friday. Improving on-chain and derivatives data point to growing bullish interest, while the technical outlook keeps an upside breakout in focus.

Economic outlook 2026-2027 in advanced countries: Solidity test

After a year marked by global economic resilience and ending on a note of optimism, 2026 looks promising and could be a year of solid economic performance. In our baseline scenario, we expect most of the supportive factors at work in 2025 to continue to play a role in 2026.

Crypto market outlook for 2026

Year 2025 was volatile, as crypto often is.  Among positive catalysts were favourable regulatory changes in the U.S., rise of Digital Asset Treasuries (DAT), adoption of AI and tokenization of Real-World-Assets (RWA).