GBP/USD Price Analysis: Mean reversion to near 20-EMA around 1.2050 looks likely
- The heat of the risk-aversion theme has dragged the Cable below 1.2230.
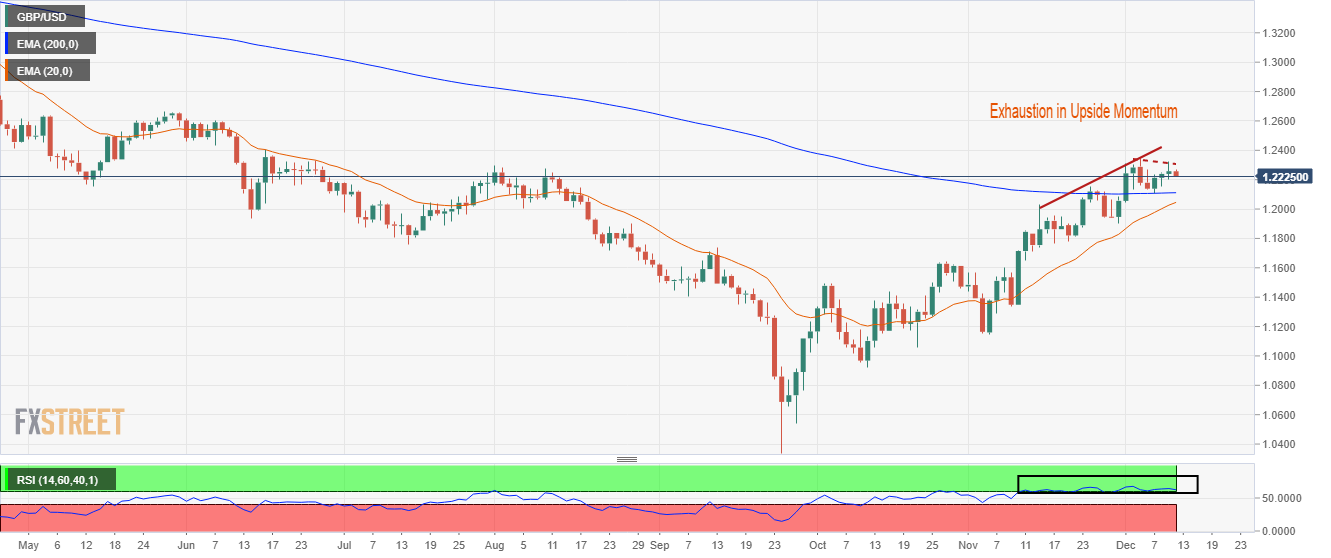
- No trend can be undisputed for a secular period, therefore, a corrective move to near the 20-EMA cannot be ruled out.
- The RSI (14) has shown signs of deceleration in the upside momentum.

The GBP/USD pair has extended its losses below 1.2230 in the Asian session after failing to sustain above the round-level resistance of 1.2300. The Cable is facing the heat of risk-aversion theme as investors are getting anxious ahead of the monetary policy announcement by the Federal Reserve (Fed) and the Bank of England (BOE).
The US Dollar Index (DXY) has climbed firmly to near 105.20 in Tokyo and is expected to extend gains further amid an improvement in safe-haven’s appeal. Meanwhile, the 10-year US Treasury yields are hovering above 3.5%.
On a daily scale, the Cable is continuously moving north and has not displayed a mean-reversion to near 20-period Exponential Moving Average (EMA). No trend can be undisputed for a secular period, therefore, a corrective move to near the 20-EMA cannot be ruled out. Also, the Pound Sterling has shown signs of exhaustion in the upside trend.
The Cable is auctioning above the 200-EMA at 1.2116, which indicates that the upside trend is still intact.
Meanwhile, a continuous oscillation in the bullish range of 60.00-80.00 by the Relative Strength Index (RSI) (14) is showing signs of overbought.
Should the Cable drops below Friday’s low around 1.2200, the US Dollar bulls will drag the asset towards the 200-EMA at 1.2116 and the 20-EMA at 1.2050.
On the contrary, a decisive break above December 5 high at 1.2345 will drive the asset toward the round-level resistance at 1.2400, followed by the psychological resistance at 1.2500.
GBP/USD daily chart
Author

Sagar Dua
FXStreet
Sagar Dua is associated with the financial markets from his college days. Along with pursuing post-graduation in Commerce in 2014, he started his markets training with chart analysis.


