|

GBP/USD Price Analysis: Marches towards 1.1900 as yields extend losses

  • An improvement in risk appetite is shifting momentum towards risk-sensitive currencies.
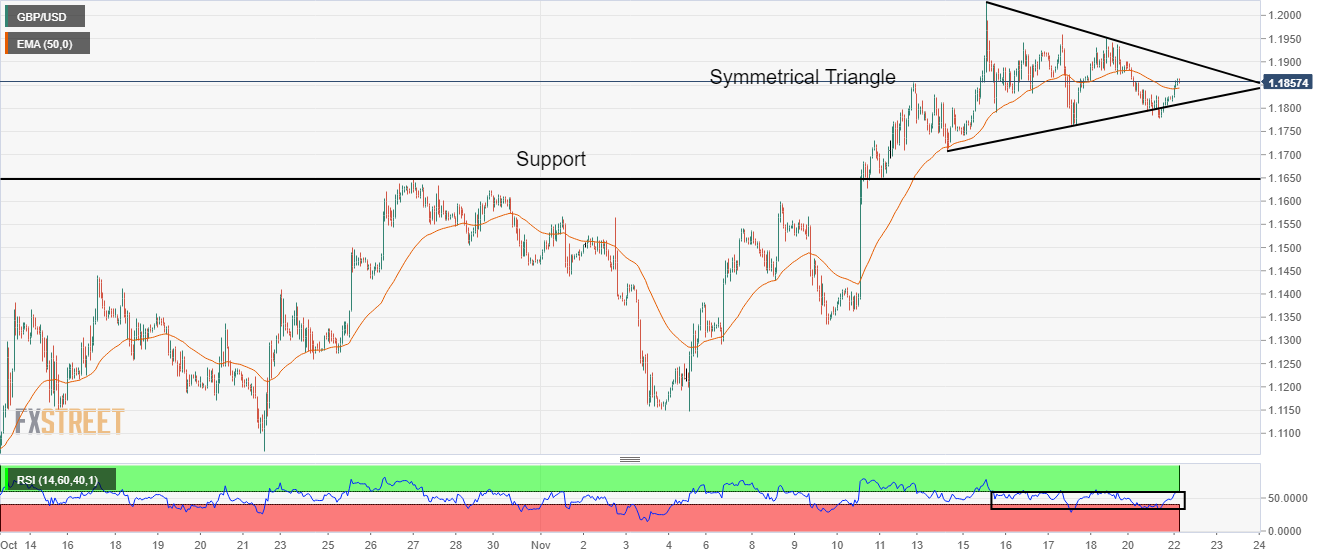
  • The Cable is heading towards the downward-sloping trendline of the symmetrical triangle.
  • Overlapping 20-EMA with asset indicates a consolidation head.

The GBP/USD pair has witnessed a steep rise to near 1.1856 in the Tokyo session after sensing buying interest below 1.1800. The Cable is marching towards the round-level resistance of 1.1900 as the risk appetite of the market participants has improved.

Meanwhile, the mighty US dollar index (DXY) has dropped below 107.58 amid a decline in safe-haven's appeal. The US Treasury yields are facing immense pressure led by vanishing confidence for the continuation of bigger rate hike announcements by the Federal Reserve (Fed).

On an hourly scale, the asset is forming a symmetrical triangle chart pattern, which indicates a sheer slippage in volatility. The asset is advancing towards the downward-sloping trendline, plotted from November 15 high at 1.2029 while the upward-sloping trendline of the chart pattern is placed from November 14 low at 1.1710.

The 20-period Exponential Moving Average (EMA) at 1.1844 is overlapping with Cable prices, which indicates a consolidation ahead.

On the contrary, the Relative Strength Index (RSI) (14) is attempting to shift into the bullish range of 60.00-80.00, for upside momentum.

Going forward, a break above Friday’s high at 1.1950 will drive Cable towards November 15 high at 1.2029, followed by the round-level resistance at 1.2100.

On the flip side, a drop below Monday’s low at 1.1780 will drag the asset toward November 14 low at 1.1710. A slippage below November 14 low will expose the asset to the horizontal support plotted from October 27 high at 1.1646.

GBP/USD hourly chart

GBP/USD

Overview
Today last price1.1857
Today Daily Change0.0037
Today Daily Change %0.31
Today daily open1.182
 
Trends
Daily SMA201.1611
Daily SMA501.1372
Daily SMA1001.1642
Daily SMA2001.2215
 
Levels
Previous Daily High1.1902
Previous Daily Low1.1779
Previous Weekly High1.2029
Previous Weekly Low1.171
Previous Monthly High1.1646
Previous Monthly Low1.0924
Daily Fibonacci 38.2%1.1826
Daily Fibonacci 61.8%1.1855
Daily Pivot Point S11.1765
Daily Pivot Point S21.171
Daily Pivot Point S31.1642
Daily Pivot Point R11.1888
Daily Pivot Point R21.1956
Daily Pivot Point R31.2011

Author

Sagar Dua

Sagar Dua

FXStreet

Sagar Dua is associated with the financial markets from his college days. Along with pursuing post-graduation in Commerce in 2014, he started his markets training with chart analysis.

More from Sagar Dua
Share:

Markets move fast. We move first.

Orange Juice Newsletter brings you expert driven insights - not headlines. Every day on your inbox.

By subscribing you agree to our Terms and conditions.

Editor's Picks

EUR/USD struggles below 1.1750 as 2025 draws to a close

EUR/USD struggles below 1.1750 in the European session on Wednesday, the final day of 2025. The pair is under pressure as the US Dollar edges higher despite Federal Open Market Committee (FOMC) Minutes of the December policy meeting, released on Tuesday, showing that most policymakers stressed the need for further interest rate cuts.

GBP/USD stays weak near 1.3450 amid renewed USD demand

GBP/USD remains under pressure near 1.3450 in European trading on Wednesday. The US Dollar finds fresh demand due to the end-of-the-year position adjustments, weighing on the pair amid the pre-New Year trading lull. 

Gold recovers losses above $4,300 amid the year-end grind

Gold price reverses a dip below $4,300 in the European trading hours on Wednesday, recovering intraday losses. The precious metal draws support from the prospect of further US interest rate cuts in 2026. Gold has surged about 65% this year and is set to record its biggest annual gains since 1979.

Bitcoin, Ethereum and XRP prepare for a potential New Year rebound

Bitcoin, Ethereum, and Ripple are holding steady on Wednesday after recording minor gains on the previous day. Technically, Bitcoin could extend gains within a triangle pattern while Ethereum and Ripple face critical overhead resistance. 

Economic outlook 2026-2027 in advanced countries: Solidity test

After a year marked by global economic resilience and ending on a note of optimism, 2026 looks promising and could be a year of solid economic performance. In our baseline scenario, we expect most of the supportive factors at work in 2025 to continue to play a role in 2026.

Crypto market outlook for 2026

Year 2025 was volatile, as crypto often is.  Among positive catalysts were favourable regulatory changes in the U.S., rise of Digital Asset Treasuries (DAT), adoption of AI and tokenization of Real-World-Assets (RWA).