GBP/USD Price Analysis: March high of 1.3200 lures the bulls
- GBP/USD remains positive near the highest since March 09.
- A sustained break of the yearly resistance line, bullish MACD favor the buyers.
- Overbought RSI could play its role if prices slip below 1.3020.

GBP/USD takes the bids near 1.3100 during the early Friday morning in Asia. The Cable crossed a downward sloping trend line from December 31, 2019, the previous day. The same gains support from bullish MACD to challenge the March month’s top.
Although 1.3200 is teasing the bulls, multiple upside barriers, comprising highs marked since 2019-end, could challenge the pair’s further upside between 1.3215 and 1.3285.
Should there be a clear run-up past-1.3285, the yaer 2019 peak near 1.3515 level will become the bulls' favorite.
On the contrary, overbought RSI conditions push the traders to remain cautious if the GBP/USD prices slip below the resistance-turned-support of 1.3020. Though, sellers may wait for a confirmation below 1.3000 while targeting June month’s high of 1.2813.
During the quote’s further weakness past-1.2813, a 200-day SMA level of 1.2706 could flash on the bears’ radars.
GBP/USD daily chart
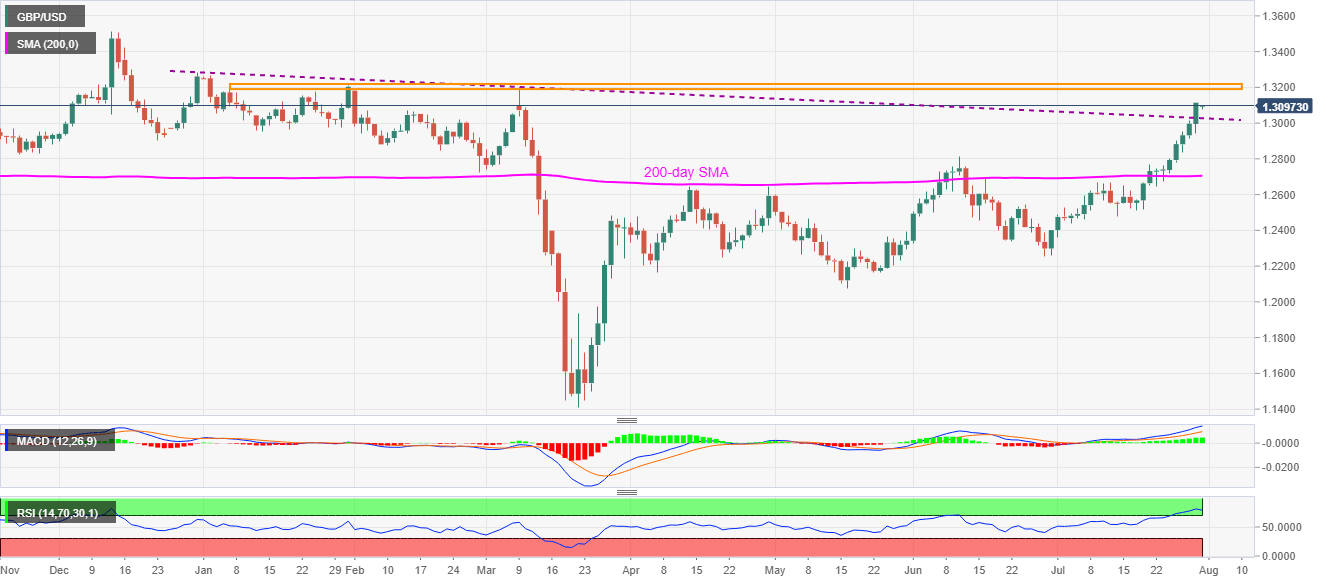
Trend: Bullish
Author

Anil Panchal
FXStreet
Anil Panchal has nearly 15 years of experience in tracking financial markets. With a keen interest in macroeconomics, Anil aptly tracks global news/updates and stays well-informed about the global financial moves and their implications.


