|

GBP/USD Price Analysis: Hits one-month tops, 1.4000 mark is the next stop for bulls

  • GBP/USD continued scaling higher for the sixth straight session amid sustained USD selling.
  • The stage now seems set for a move towards March swing highs, around the 1.4000 mark.
  • Slightly overbought RSI on hourly charts warrants caution before placing aggressive bets.

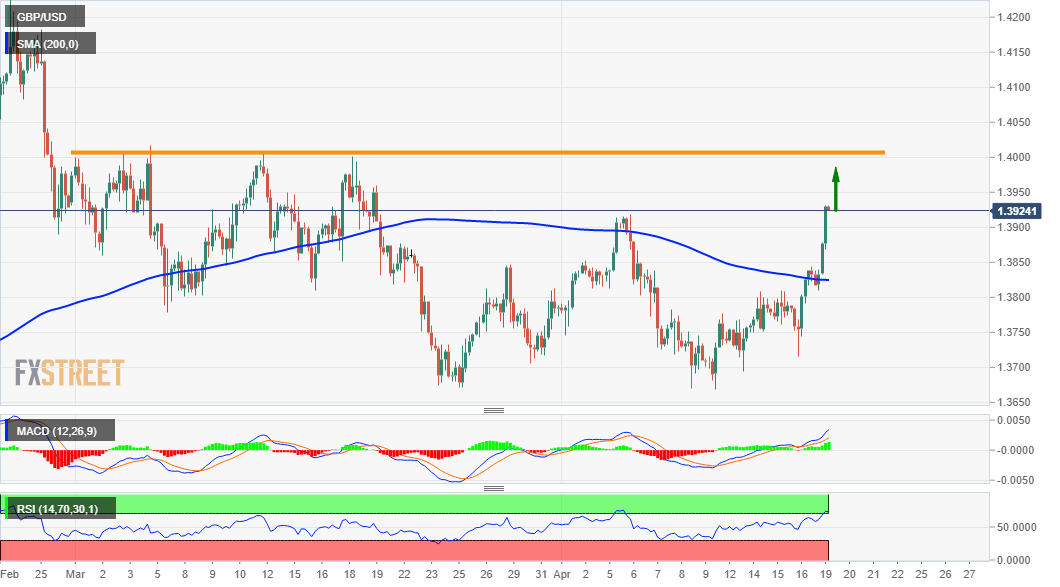
The GBP/USD pair gained strong follow-through traction for the sixth consecutive day on Monday and jumped to one-month tops, around the 1.3925 region during the mid-European session.

The bearish pressure surrounding the US dollar remained unabated amid expectations that the Fed will keep interest rates lower for a longer period. This, in turn, was seen as a key factor that allowed the GBP/USD pair to build on last week's solid rebound from 100-day SMA support, near the 1.3670 area.

Looking at the technical picture, a decisive breakthrough a one-month-old descending trend-line and the 1.3900 mark was seen as a key trigger for intraday bullish traders. A subsequent strength beyond the monthly swing highs, around the 1.3920 region might have set the stage for additional gains.

The constructive set-up is reinforced by the fact that technical indicators on the daily chart have just started moving into the positive territory. That said, RSI (14) on hourly charts is already flashing slightly overbought conditions and warrants some caution for aggressive bullish traders.

Nevertheless, the price action suggests that the path of least resistance for the GBP/USD pair is to the upside. Hence, a move back towards reclaiming the key 1.4000 psychological mark, which coincides with March monthly swing highs, looks a distinct possibility amid an empty US economic docket.

On the flip side, the 1.3900 mark now seems to act as immediate strong support. Any further weakness might now be seen as a buying opportunity. This, in turn, should help limit the downside near a support marked by the 200-period SMA on the 4-hourly chart, around the 1.3830-25 region.

GBP/USD 4-hour chart

fxsoriginal

Technical levels to watch

GBP/USD

Overview
Today last price1.3929
Today Daily Change0.0097
Today Daily Change %0.70
Today daily open1.3832
 
Trends
Daily SMA201.3778
Daily SMA501.3864
Daily SMA1001.3707
Daily SMA2001.3364
 
Levels
Previous Daily High1.3844
Previous Daily Low1.3716
Previous Weekly High1.3844
Previous Weekly Low1.3669
Previous Monthly High1.4017
Previous Monthly Low1.3671
Daily Fibonacci 38.2%1.3795
Daily Fibonacci 61.8%1.3765
Daily Pivot Point S11.3751
Daily Pivot Point S21.3669
Daily Pivot Point S31.3623
Daily Pivot Point R11.3879
Daily Pivot Point R21.3925
Daily Pivot Point R31.4007

Author

Haresh Menghani

Haresh Menghani is a detail-oriented professional with 10+ years of extensive experience in analysing the global financial markets.

More from Haresh Menghani
Share:

Editor's Picks

EUR/USD retreats toward 1.1600 after upbeat US data

EUR/USD pulls away from session highs and declines toward 1.1600 in the American session on Wednesday. Upbeat private sector employment and ISM Services PMI data from the US help the US Dollar (USD) stay resilient against its rivals, limiting the pair's upside.

GBP/USD meets resistance around 1.3400

In line with its risk-linked peers, GBP/USD stages a modest comeback on Wednesday, although meeting some resistance around the 1.3400 neighbourhood. Cable’s humble recovery struggles to gather momentum as the Greenback benefits from better-than-forecast macroeconomic data releases.

Gold loses traction after testing $5,200

Gold corrects lower after testing $5,200 but manages to stay in positive territory in the second hald of the day on Wednesday. The precious metal remains well supported by the deterioration of the geopolitical scenario in the Middle East, while the US Dollar's resilience caps the upside.

Crypto Today: Bitcoin, Ethereum, XRP rebound amid mixed ETF flows

The cryptocurrency market is showing subtle recovery signs despite heightened global uncertainty following the United States (US) and Israel attacks on Iran and the subsequent retaliations that have morphed into a wider Middle East war.

First Venezuela, now Iran: The US-China energy war escalates

At first glance, the latest escalation involving the United States with both Iran and Venezuela looks like another chapter in a long-running geopolitical story. But viewed through a broader strategic lens, something else may be unfolding: Energy.

Solana Price Forecast: SOL consolidation near resistance as ETF inflows offer mild support

Solana price is facing slight rejection as it approaches the upper boundary of the consolidation range at around $88 on Wednesday. Institutional demand is strengthening as spot Exchange Traded Funds recorded two consecutive inflows so far this week.