|

GBP/USD Price Analysis: Further upside hinges on 1.2310 breakout, UK inflation

  • GBP/USD fades upside momentum after two-day advances, retreats of late.
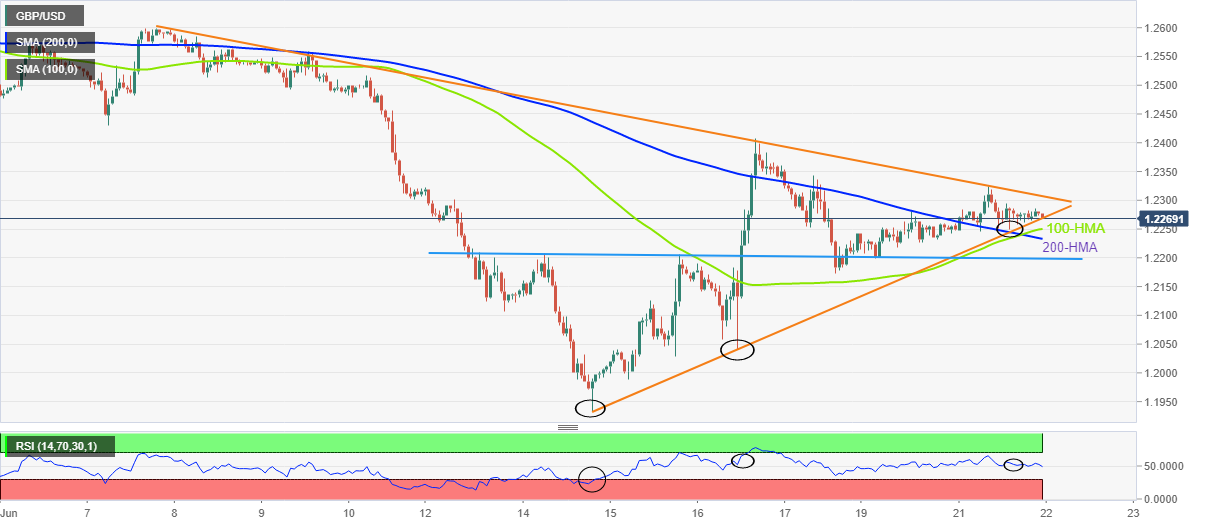
  • Sustained trading beyond the key HMAs, bullish RSI formation keep buyers hopeful.
  • Short-term triangle restricts immediate moves ahead of UK CPI data for May.

GBP/USD struggles to extend the weekly rebound as bulls take a breather around 1.2275 during Wednesday’s Asian session. In doing so, the cable pair funnels down to the short-term triangle break.

However, the quote’s successful trading above the 100-HMA and 200-HMA, as well as the RSI’s support to the recent higher lows on prices, keeps the pair buyers hopeful.

That said, the latest pullback remains elusive until the quote stays above the 200-HMA support of 1.2230. Before that, the stated triangle’s support line and the 100-HMA may entertain GBP/USD sellers around 1.2265 and 1.2250 respectively.

In a case where the cable pair remains weak past 1.2250, weekly horizontal support near 1.2200 and Friday’s low of 1.2172 should gain the bear’s attention.

Meanwhile, recovery moves need validation from the 1.2310 hurdle, comprising the aforementioned triangle’s resistance line.

Following that, the mid-June swing high of 1.2406 and early month bottom around 1.2430 may rest the GBP/USD pair buyers before directing the run-up towards the monthly peak of 1.2616.

It should be noted that the UK Consumer Price Index (CPI) is likely to increase to 9.1% in May from 9.0%, which in turn suggests more urgency on the part of the Bank of England (BOE) to propel rates. The same could favor the GBP/USD buyers in case of firmer data.

GBP/USD: Hourly chart

Trend: Further upside expected

Additional important levels

Overview
Today last price1.227
Today Daily Change0.0018
Today Daily Change %0.15%
Today daily open1.2252
 
Trends
Daily SMA201.2439
Daily SMA501.2545
Daily SMA1001.2923
Daily SMA2001.3222
 
Levels
Previous Daily High1.228
Previous Daily Low1.2199
Previous Weekly High1.2407
Previous Weekly Low1.1934
Previous Monthly High1.2667
Previous Monthly Low1.2155
Daily Fibonacci 38.2%1.2249
Daily Fibonacci 61.8%1.223
Daily Pivot Point S11.2208
Daily Pivot Point S21.2163
Daily Pivot Point S31.2126
Daily Pivot Point R11.2289
Daily Pivot Point R21.2325
Daily Pivot Point R31.237

Author

Anil Panchal

Anil Panchal

FXStreet

Anil Panchal has nearly 15 years of experience in tracking financial markets. With a keen interest in macroeconomics, Anil aptly tracks global news/updates and stays well-informed about the global financial moves and their implications.

More from Anil Panchal
Share:

Editor's Picks

EUR/USD seems fragile below 1.1700 as Middle East war boosts energy prices

The EUR/USD pair trades flat at around 1.1680 during the Asian trading session on Tuesday, but broadly seems vulnerable, being close to its five-week low. The major currency pair is under pressure as surging oil prices due to the United States-Israel war with Iran have increased the risks of higher inflation for the Old Continent.

GBP/USD hovers around 1.3400 with bearish pressure intact

GBP/USD edges higher after three days of losses, trading around 1.3400 during the Asian hours on Tuesday. The technical analysis of the daily chart indicates an ongoing bearish bias, as the pair trades within a descending channel pattern.

Gold sticks to gains above $5,350 amid sustained safe-haven demand; firmer USD caps gains

Gold sticks to its positive bias for the third straight day and trades above the $5,350 level heading into the European session on Tuesday. Concerns about a broader regional conflict in the Middle East continue to weigh on investors' sentiment and underpin demand for the traditional safe-haven bullion.

Stellar risks deeper losses as derivatives metrics turn negative

Stellar is trading red below $0.16 at the time of writing on Tuesday, after a slight recovery the previous day. Weakening derivatives data caps the recovery, while an unfavorable technical outlook projects a deeper correction for the XLM token in the upcoming days.

The market is not panicking it is repricing the probability distribution of Oil and time

At the end of the day, markets do not trade morality or geopolitics. They trade transmission channels. And the only channel that truly matters in this maelstrom runs through the price of energy and the time value of money.

Grass 20% bullish breakout defies broader market weakness

Grass (GRASS) is edging up above $0.30 at the time of writing on Monday. The token’s notable 20% intraday surge stands out amid heightened volatility in the broader crypto market.