GBP/USD Price Analysis: Further downside hinges on 1.1995 break
- GBP/USD remains pressured around two-week low, after breaking monthly support line.
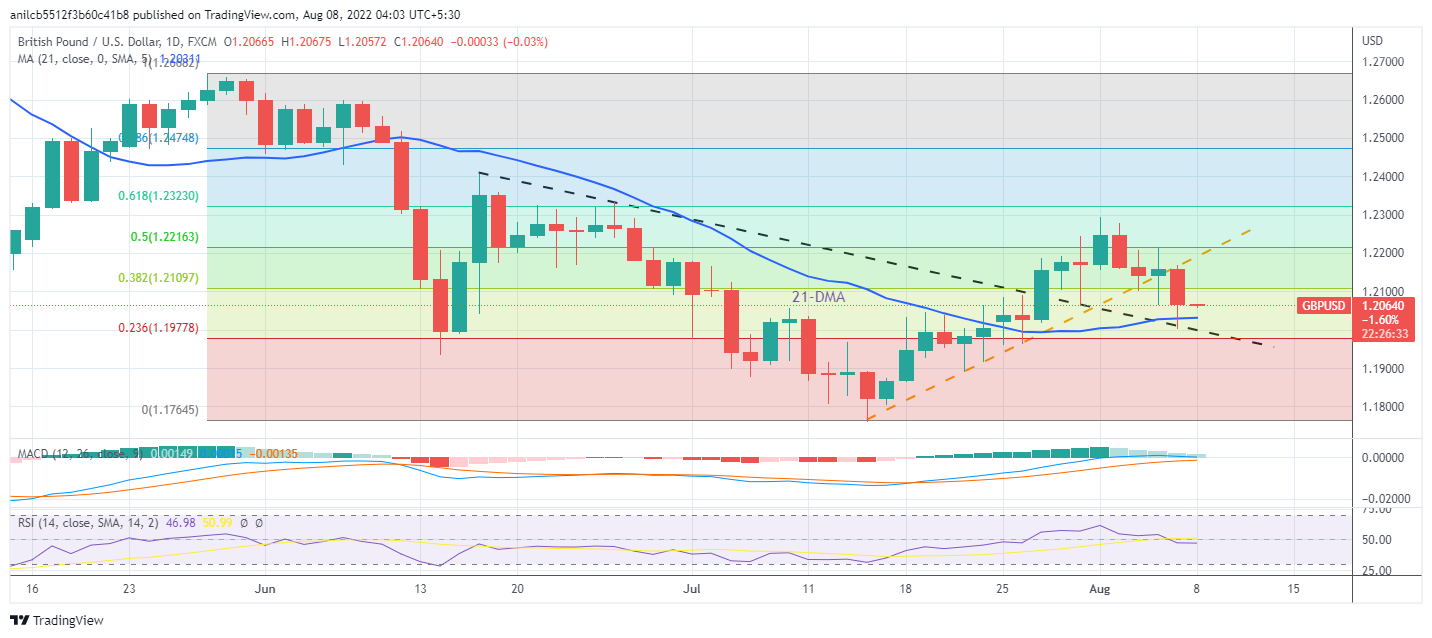
- 21-DMA, the previous resistance line from mid-June appear to challenge the bears.
- RSI, MACD also favor sellers whereas buyers have tough challenges ahead.

GBP/USD keeps Friday’s bearish bias as sellers attack 21-DMA support during Monday’s initial Asian session. In doing so, the Cable pair holds onto the previous day’s downside break of the one-month-old previous support line around a fortnight low, near 1.2060 by the press time.
In addition to the trend line breakdown, the recently easing bullish bias of the MACD and the RSI (14) retreat also keep the GBP/USD sellers hopeful.
However, the 21-DMA and the resistance-turned-support from mid-June, respectively near 1.2030 and 1.1995, seem to restrict the quote’s short-term downside.
Also acting as the downside filter is the June month’s low near 1.1935 and the yearly bottom marked in July surrounding 1.1760.
Alternatively, recovery moves may initially aim for the previous support line from July 14, around 1.2190 at the latest.
Following that, the monthly peak and the 61.8% Fibonacci retracement of the late May to mid-July downturn, close to 1.2295 and 1.2325 in that order, could challenge the GBP/USD buyers.
Even if the quote crosses the 1.2325 hurdle, the 78.6% Fibonacci retracement level near 1.2475 could test the upside momentum.
Overall, GBP/USD is likely to witness further downside but the room towards the south appears limited.
GBP/USD: Daily chart
Trend: Limited downside expected
Author

Anil Panchal
FXStreet
Anil Panchal has nearly 15 years of experience in tracking financial markets. With a keen interest in macroeconomics, Anil aptly tracks global news/updates and stays well-informed about the global financial moves and their implications.


