GBP/USD Price Analysis: Edges lower yet remains above 1.2800
- GBP/USD drops 0.32% as BoE cuts rates to 5.25% in a tight 5-4 vote.
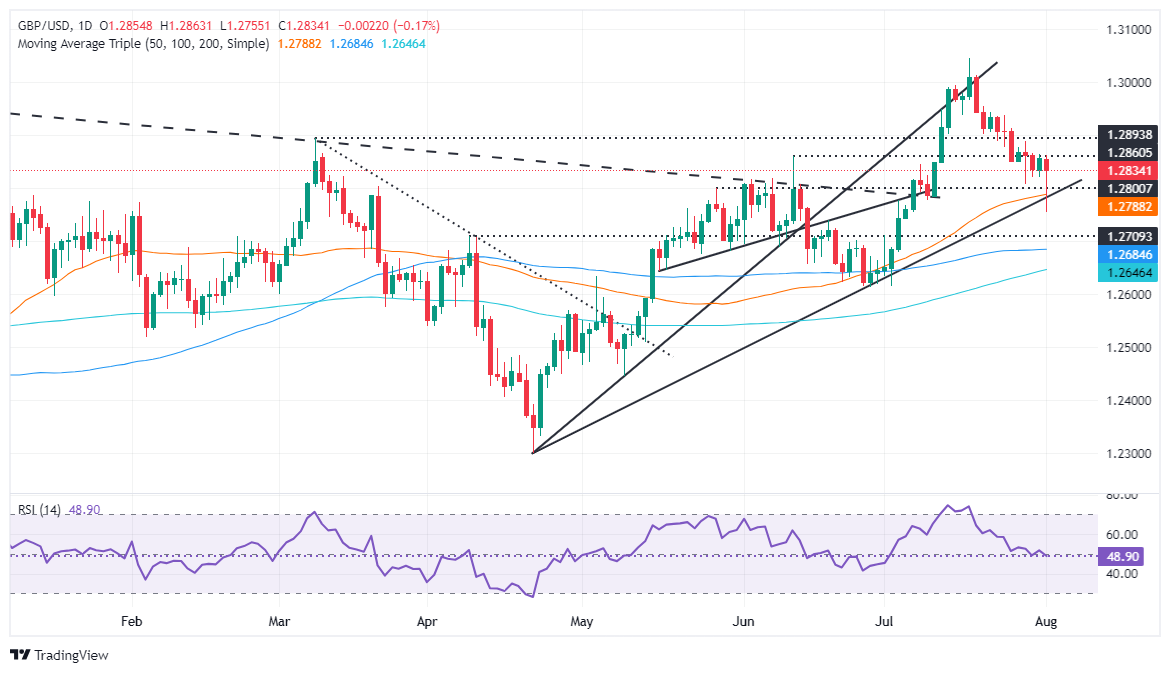
- Technical outlook suggests potential rebound, forming a 'hammer' pattern.
- Key resistance levels at 1.2888, 1.2900, and 1.2937; support levels at 1.2786, 1.2750, and 1.2700.

The Pound Sterling is under pressure in early trading during the North American session, dropping some 0.12% after the Bank of England (BoE) cut interest rates to 5.25% in a 5-4 tight vote split. Following the decision, the GBP/USD fell to its lowest level of 1.2750, yet has recovered somewhat, trimming some of its losses. The pair exchanges hands at 1.2837 at the time of writing.
GBP/USD Price Analysis: Technical outlook
Following the BoE’s decision, the GBP/USD seems to form a ‘hammer’ preceded by a 2.20% fall, which could open the door to climbing above the 1.2900 figure and re-testing the 1.3000 figure. Although BoE Governor Bailey and Co. reduced borrowing costs, the policy remains restrictive, as they upward revised their inflation expectations to 2.25%.
If GBP/USD clears the current week high at 1.2888, that could exacerbate a rally to 1.2900, followed by the latest pivot high at 1.2937, the July 24 high. A breach of the latter will expose 1.3000.
For a bearish continuation, sellers must push prices and achieve a daily close below the 50-day moving average (DMA) at 1.2786. Once surpassed, the next support would be the August 1 low of 1.2750, followed by 1.2700 and the 100-DMA at 1.2683.
GBP/USD Price Action – Daily Chart
British Pound PRICE Today
The table below shows the percentage change of British Pound (GBP) against listed major currencies today. British Pound was the strongest against the Japanese Yen.
| USD | EUR | GBP | JPY | CAD | AUD | NZD | CHF | |
|---|---|---|---|---|---|---|---|---|
| USD | 0.10% | 0.15% | 0.15% | 0.02% | -0.20% | -0.44% | -0.42% | |
| EUR | -0.10% | 0.06% | 0.05% | -0.09% | -0.29% | -0.53% | -0.52% | |
| GBP | -0.15% | -0.06% | -0.02% | -0.14% | -0.35% | -0.60% | -0.58% | |
| JPY | -0.15% | -0.05% | 0.02% | -0.15% | -0.37% | -0.66% | -0.63% | |
| CAD | -0.02% | 0.09% | 0.14% | 0.15% | -0.21% | -0.45% | -0.44% | |
| AUD | 0.20% | 0.29% | 0.35% | 0.37% | 0.21% | -0.24% | -0.23% | |
| NZD | 0.44% | 0.53% | 0.60% | 0.66% | 0.45% | 0.24% | 0.02% | |
| CHF | 0.42% | 0.52% | 0.58% | 0.63% | 0.44% | 0.23% | -0.02% |
The heat map shows percentage changes of major currencies against each other. The base currency is picked from the left column, while the quote currency is picked from the top row. For example, if you pick the British Pound from the left column and move along the horizontal line to the US Dollar, the percentage change displayed in the box will represent GBP (base)/USD (quote).
Author

Christian Borjon Valencia
FXStreet
Markets analyst, news editor, and trading instructor with over 14 years of experience across FX, commodities, US equity indices, and global macro markets.


