|

GBP/USD Price Analysis: Drops amid UK recession fears post BoE rate hike

  • GBP/USD experiences dip, shedding 0.17% following BoE’s surprise 50 bps rate hike.
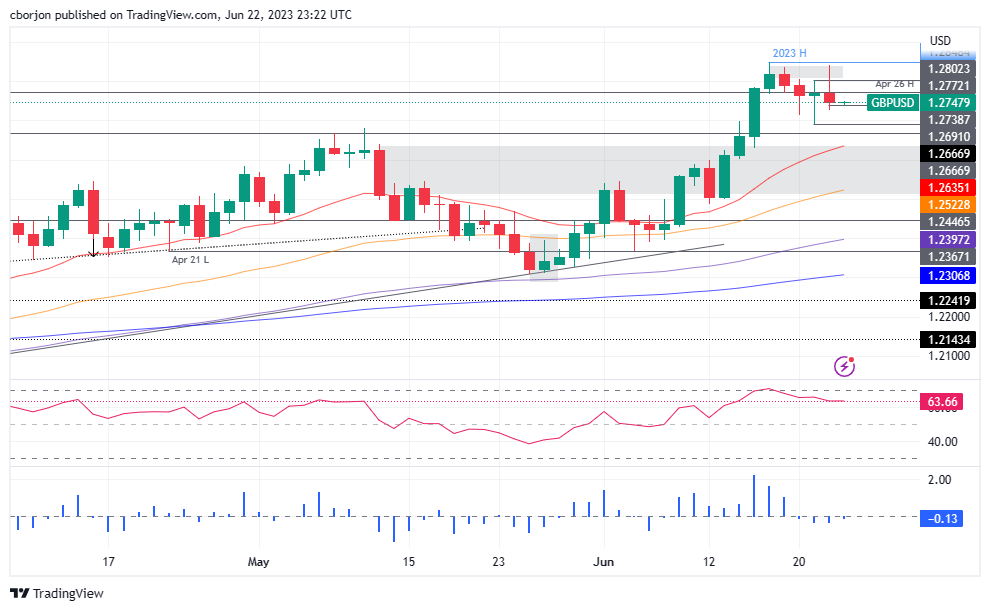
  • Technicals suggest a downward trend, with RSI exiting overbought conditions.
  • Key levels to watch: support at a weekly low of 1.2691 and resistance at a YTD high of 1.2848.

GBP/USD opened the Asian session with a  bearish mood after hitting a weekly high of 1.2841 to see those gains evaporate as UK recession fears reignited, post the Bank of England 50 bps rate hike. The GBP/USD closed on Thursday with losses of 0.17%. At the time of writing, the GBP/USD exchanges hands at 1.2742.

Must read: GBP/USD dives following unexpected BoE rate hike, sparking UK’s recession concerns

GBP/USD Price Analysis: Technical outlook

The GBP/USD remains upward biased, and the dip towards the 1.2720 area opened the door for buyers to re-enter at a lower price level. Nevertheless, the Relative Strength Index (RSI) exited overbought conditions, which triggered a sell signal, though it’s pending breaking support of the weekly low at 1.2691.

If GBP/USD drops below the latter, the next support would be the 20-day Exponential Moving Average (EMA) at 1.2635, followed by the psychological 1.2600 price level. Once cleared, the next support would be the confluence of the June 13 daily low and the 50-day EMA at 1.2499-1.2522.

Failure to drop below the weekly low, the GBP/USD would be set to re-test the 1.2800 figure. The next stop will be the year-to-date (YTD) high at 1.2848 before reaching 1.2900.

GBP/USD Price Action – Daily chart

GBP/USD Daily chart

GBP/USD

Overview
Today last price1.2748
Today Daily Change-0.0022
Today Daily Change %-0.17
Today daily open1.277
 
Trends
Daily SMA201.2551
Daily SMA501.2513
Daily SMA1001.2336
Daily SMA2001.2063
 
Levels
Previous Daily High1.2803
Previous Daily Low1.2691
Previous Weekly High1.2848
Previous Weekly Low1.2487
Previous Monthly High1.268
Previous Monthly Low1.2308
Daily Fibonacci 38.2%1.276
Daily Fibonacci 61.8%1.2734
Daily Pivot Point S11.2707
Daily Pivot Point S21.2643
Daily Pivot Point S31.2595
Daily Pivot Point R11.2818
Daily Pivot Point R21.2866
Daily Pivot Point R31.2929

Author

Christian Borjon Valencia

Markets analyst, news editor, and trading instructor with over 14 years of experience across FX, commodities, US equity indices, and global macro markets.

More from Christian Borjon Valencia
Share:

Editor's Picks

EUR/USD appears supported by the 200-day SMA, for now

Following an early pullback to multi-week lows near 1.1670, EUR/USD now manages to reclaim the 1.1700 region as the NA session draws to a close on Monday. The steep retracement in spot follows the equally strong move higher in the US Dollar, as investors continue to assess the geopolitical landscape in the wake of the US and Israel attacks on Iran.


GBP/USD hits new yearly lows near 1.3300

GBP/USD adds to the recent bearish tone, approaching to the key 1.3300 support to reach fresh YTD troughs against the backdrop of the robust performance of the US Dollar. Indeed, Cable’s decline comes amid the firm demand for the safe-haven space in the wake of the US and Israel attacks to Iran.

Gold clings to gains as US-Iran conflict continues to underpin safe-haven assets

Gold retains positive bias for the fifth consecutive day on Tuesday as rising geopolitical tensions in the Middle East continue to underpin safe-haven assets. However, a bullish US Dollar could keep the bullion below its highest level since late January, set on Monday, warranting caution before positioning for any further appreciation.

Strategy lifts holdings to 3.4% of Bitcoin's total supply amid inflows into crypto products

Strategy continued its accumulation of the top crypto last week, acquiring 3,015 BTC for $204 million amid renewed interest in crypto products after four weeks of outflows.

The Fed is finally talking about AI – Here's why it matters for the US Dollar

AI is moving from earnings calls into the heart of monetary policy discussions, forcing Federal Reserve officials to confront a new question: How to act if AI reshapes inflation, employment and interest rates at the same time?

Grass 20% bullish breakout defies broader market weakness

Grass (GRASS) is edging up above $0.30 at the time of writing on Monday. The token’s notable 20% intraday surge stands out amid heightened volatility in the broader crypto market.