GBP/USD Price Analysis: Double tops around 1.2250 tease Cable sellers ahead of key UK data


  • GBP/USD retreats from intraday high to pare the biggest weekly gain since late November.
  • RSI pullback from nearly overbought conditions adds strength to the pullback moves.
  • 200-SMA, weekly support line appears crucial challenge for bears.
  • UK monthly GDP, output and trade numbers for November will be crucial to watch.

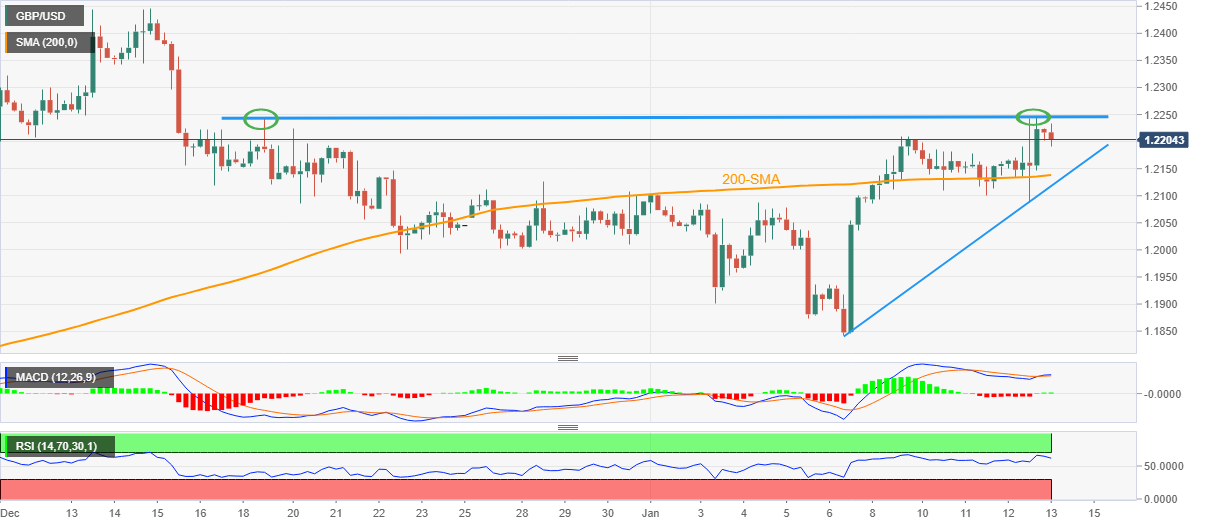
GBP/USD prints mild losses around 1.2200 as bulls take a breather at the monthly high ahead of the key UK data on early Friday. In doing so, the Cable pair consolidates the biggest weekly gains in six while printing the double top bearish chart formation on the four-hour play.

Also read: GBP/USD picks demand around 1.2200 as risk appetite improves further

Additionally, teasing the GBP/USD bears could be the sluggish MACD signals and the RSI (14) retreat from the nearly overbought region.

However, the 200-SMA and an upward-sloping trend line from January 06, respectively near 1.2140 and 1.2115, appear tough nuts to crack for the GBP/USD pair sellers.

Following that, a downward trajectory toward the monthly low of 1.1841 can’t be ruled out.

It’s worth noting that the GBP/USD weakness past 1.1841 will confirm the “double tops” and will theoretically signal a south-run to 1.1440.

Alternatively, an upside clearance of the 1.2250 level will defy the bearish chart pattern, which in turn will direct GBP/USD buyers towards the previous monthly high surrounding 1.2445-50.

In case where the Cable pair remains firmer past 1.2450, its run-up towards May 2022 high near 1.2665 can’t be ruled out.

GBP/USD: Four-hour chart

Trend: Further downside expected

Additional important levels

Overview
Today last price 1.2207
Today Daily Change -0.0007
Today Daily Change % -0.06%
Today daily open 1.2214
 
Trends
Daily SMA20 1.2084
Daily SMA50 1.202
Daily SMA100 1.1683
Daily SMA200 1.2001
 
Levels
Previous Daily High 1.2247
Previous Daily Low 1.2088
Previous Weekly High 1.2102
Previous Weekly Low 1.1841
Previous Monthly High 1.2447
Previous Monthly Low 1.1992
Daily Fibonacci 38.2% 1.2186
Daily Fibonacci 61.8% 1.2149
Daily Pivot Point S1 1.212
Daily Pivot Point S2 1.2025
Daily Pivot Point S3 1.1961
Daily Pivot Point R1 1.2278
Daily Pivot Point R2 1.2342
Daily Pivot Point R3 1.2437


Share: Feed news

Information on these pages contains forward-looking statements that involve risks and uncertainties. Markets and instruments profiled on this page are for informational purposes only and should not in any way come across as a recommendation to buy or sell in these assets. You should do your own thorough research before making any investment decisions. FXStreet does not in any way guarantee that this information is free from mistakes, errors, or material misstatements. It also does not guarantee that this information is of a timely nature. Investing in Open Markets involves a great deal of risk, including the loss of all or a portion of your investment, as well as emotional distress. All risks, losses and costs associated with investing, including total loss of principal, are your responsibility. The views and opinions expressed in this article are those of the authors and do not necessarily reflect the official policy or position of FXStreet nor its advertisers. The author will not be held responsible for information that is found at the end of links posted on this page.

If not otherwise explicitly mentioned in the body of the article, at the time of writing, the author has no position in any stock mentioned in this article and no business relationship with any company mentioned. The author has not received compensation for writing this article, other than from FXStreet.

FXStreet and the author do not provide personalized recommendations. The author makes no representations as to the accuracy, completeness, or suitability of this information. FXStreet and the author will not be liable for any errors, omissions or any losses, injuries or damages arising from this information and its display or use. Errors and omissions excepted.

The author and FXStreet are not registered investment advisors and nothing in this article is intended to be investment advice.

Recommended content


Recommended content

Editors’ Picks

EUR/USD clings to daily gains above 1.0650

EUR/USD clings to daily gains above 1.0650

EUR/USD gained traction and turned positive on the day above 1.0650. The improvement seen in risk mood following the earlier flight to safety weighs on the US Dollar ahead of the weekend and helps the pair push higher.

EUR/USD News

GBP/USD recovers toward 1.2450 after UK Retail Sales data

GBP/USD recovers toward 1.2450 after UK Retail Sales data

GBP/USD reversed its direction and advanced to the 1.2450 area after touching a fresh multi-month low below 1.2400 in the Asian session. The positive shift seen in risk mood on easing fears over a deepening Iran-Israel conflict supports the pair.

GBP/USD News

Gold holds steady at around $2,380 following earlier spike

Gold holds steady at around $2,380 following earlier spike

Gold stabilized near $2,380 after spiking above $2,400 with the immediate reaction to reports of Israel striking Iran. Meanwhile, the pullback seen in the US Treasury bond yields helps XAU/USD hold its ground.

Gold News

Bitcoin Weekly Forecast: BTC post-halving rally could be partially priced in Premium

Bitcoin Weekly Forecast: BTC post-halving rally could be partially priced in

Bitcoin price shows no signs of directional bias while it holds above  $60,000. The fourth BTC halving is partially priced in, according to Deutsche Bank’s research. 

Read more

Week ahead – US GDP and BoJ decision on top of next week’s agenda

Week ahead – US GDP and BoJ decision on top of next week’s agenda

US GDP, core PCE and PMIs the next tests for the Dollar. Investors await BoJ for guidance about next rate hike. EU and UK PMIs, as well as Australian CPIs also on tap.

Read more

Forex MAJORS

Cryptocurrencies

Signatures