|

GBP/USD Price Analysis: Doji candlesticks around 1.2430 flashes bulls/bears’ indecision

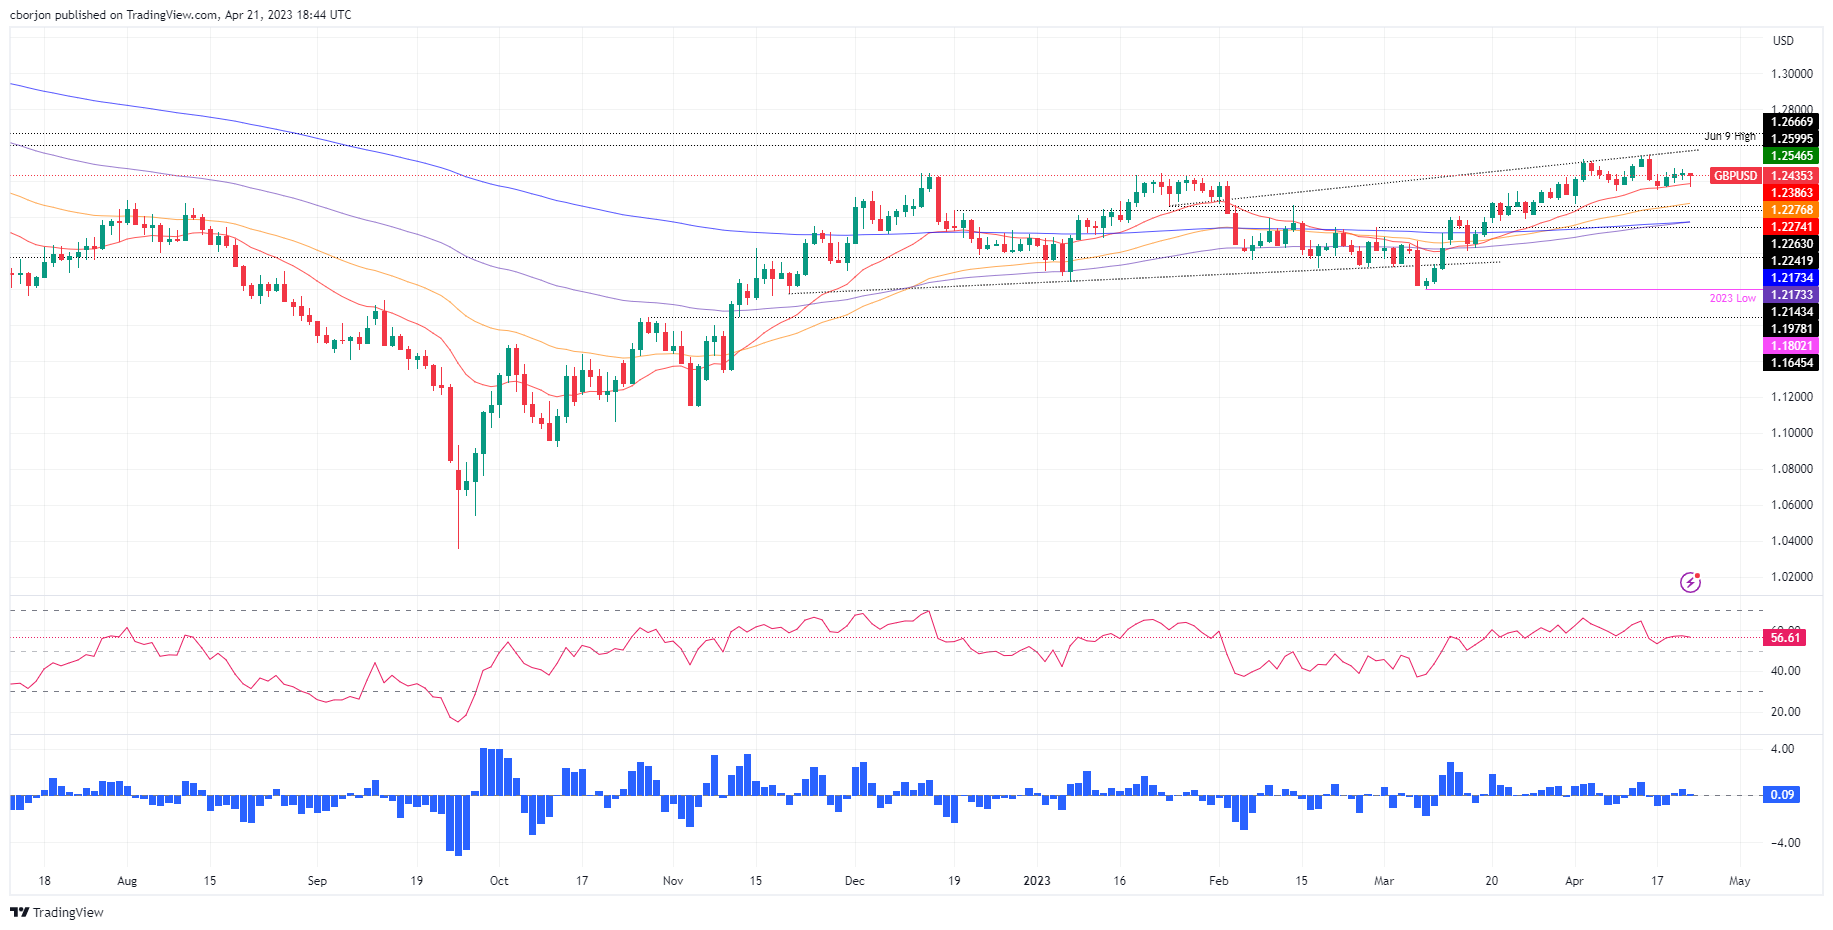
  • GBP/USD cracking 1.2400 could trigger a bearish resumption, exposing 100 and 200-day EMAs at 1.2173.
  • Buyers pushing GBP/USD above 1.2400 could spark upward momentum and test YTD high at 1.2546.

After a tranche of UK and US economic data, GBP/USD stays in sideways choppy trading, keeping the pair scrambling for direction following the last three days of uncertainty. From a technical perspective, three doji’s in a row suggests neither buyers’ nor sellers’ commitment to open fresh positions. Hence, GBP/USD is trading at 1.2439 after printing a low at 1.2367, below the 20-day Exponential Moving Average (EMA).

GBP/USD Price Action

Friday’s session was titled downwards, but since the early North American session, the GBP/USD aimed up, about to erase its earlier losses. Although the GBP/USD warrants further upside, price action in the last few days suggests buyers might be losing momentum. Indicators, like the Relative Strength Index (RSI), turned flat though tilted downwards, heading into neutral territory. At the same time, the Rate of Change (RoC) edged lower when compared to Thursday’s price action, suggesting that buying pressure is fading.

Therefore, the GBP/USD path of least resistance is downwards. The GBP/USD needs to crack the 1.2400 figure for a bearish resumption. Once cleared, the pair could dive towards the 20-day EMA at 1.2386, followed by the confluence of the April 3 low and the 50-day EMA at 1.2274/76. A breach of the latter and the GBP/USD could plunge toward the confluence of the 100 and 200-day Emas, around 1.2173.

On the flip side, if GBP/USD stays above 1.2400, it could test the April 19 cycle high at 1.2474. Buyers reclaiming the latter, upside risks will clear at 1.2500, followed by the YTD high at 1.2546.

GBP/USD Daily Chart

GBP/USD Daily Chart

GBP/USD

Overview
Today last price1.2437
Today Daily Change-0.0006
Today Daily Change %-0.05
Today daily open1.2443
 
Trends
Daily SMA201.2402
Daily SMA501.2202
Daily SMA1001.2196
Daily SMA2001.1924
 
Levels
Previous Daily High1.2468
Previous Daily Low1.2405
Previous Weekly High1.2546
Previous Weekly Low1.2344
Previous Monthly High1.2424
Previous Monthly Low1.1803
Daily Fibonacci 38.2%1.2444
Daily Fibonacci 61.8%1.2429
Daily Pivot Point S11.2409
Daily Pivot Point S21.2375
Daily Pivot Point S31.2346
Daily Pivot Point R11.2473
Daily Pivot Point R21.2502
Daily Pivot Point R31.2536

Author

Christian Borjon Valencia

Christian Borjon began his career as a retail trader in 2010, mainly focused on technical analysis and strategies around it. He started as a swing trader, as he used to work in another industry unrelated to the financial markets.

More from Christian Borjon Valencia
Share:

Markets move fast. We move first.

Orange Juice Newsletter brings you expert driven insights - not headlines. Every day on your inbox.

By subscribing you agree to our Terms and conditions.

Editor's Picks

EUR/USD moves sideways below 1.1800 on Christmas Eve

EUR/USD struggles to find direction and trades in a narrow channel below 1.1800 after posting gains for two consecutive days. Bond and stock markets in the US will open at the usual time and close early on Christmas Eve, allowing the trading action to remain subdued. 

GBP/USD keeps range around 1.3500 amid quiet markets

GBP/USD keeps its range trade intact at around 1.3500 on Wednesday. The Pound Sterling holds the upper hand over the US Dollar amid pre-Christmas light trading as traders move to the sidelines heading into the holiday season. 

Gold retreats from record highs, trades below $4,500

Gold retreats after setting a new record-high above $4,520 earlier in the day and trades in a tight range below $4,500 as trading volumes thin out ahead of the Christmas break. The US Dollar selling bias remains unabated on the back of dovish Fed expectations, which continues to act as a tailwind for the bullion amid persistent geopolitical risks.

Bitcoin slips below $87,000 as ETF outflows intensify, whale participation declines

Bitcoin price continues to trade around $86,770 on Wednesday, after failing to break above the $90,000 resistance. US-listed spot ETFs record an outflow of $188.64 million on Tuesday, marking the fourth consecutive day of withdrawals.

Economic outlook 2026-2027 in advanced countries: Solidity test

After a year marked by global economic resilience and ending on a note of optimism, 2026 looks promising and could be a year of solid economic performance. In our baseline scenario, we expect most of the supportive factors at work in 2025 to continue to play a role in 2026.

Avalanche struggles near $12 as Grayscale files updated form for ETF

Avalanche trades close to $12 by press time on Wednesday, extending the nearly 2% drop from the previous day. Grayscale filed an updated form to convert its Avalanche-focused Trust into an ETF with the US Securities and Exchange Commission.