|

GBP/USD Price Analysis: Consolidates below strong resistance at around 1.2800

  • GBP/USD remains firm below 1.2800, unchanged after reaching a daily high of 1.2809.
  • Mixed US jobs data and global rate cuts influence the pair's current spot price.
  • Key levels: Support at 1.2755 (June 5 low), 1.2694 (June 3 low); resistance at 1.2800, 1.2817 (June 4 high), and YTD high of 1.2893.

The Pound Sterling stays firm during Thursday’s North American session, yet it remains below 1.2800 after hitting a daily high of 1.2809 against the US Dollar. Another major central bank slashed interest rates, while softer US jobs data keep the pair at around current spot prices. The GBP/USD trades at 1.2772, virtually unchanged.

GBP/USD Price Analysis: Technical outlook

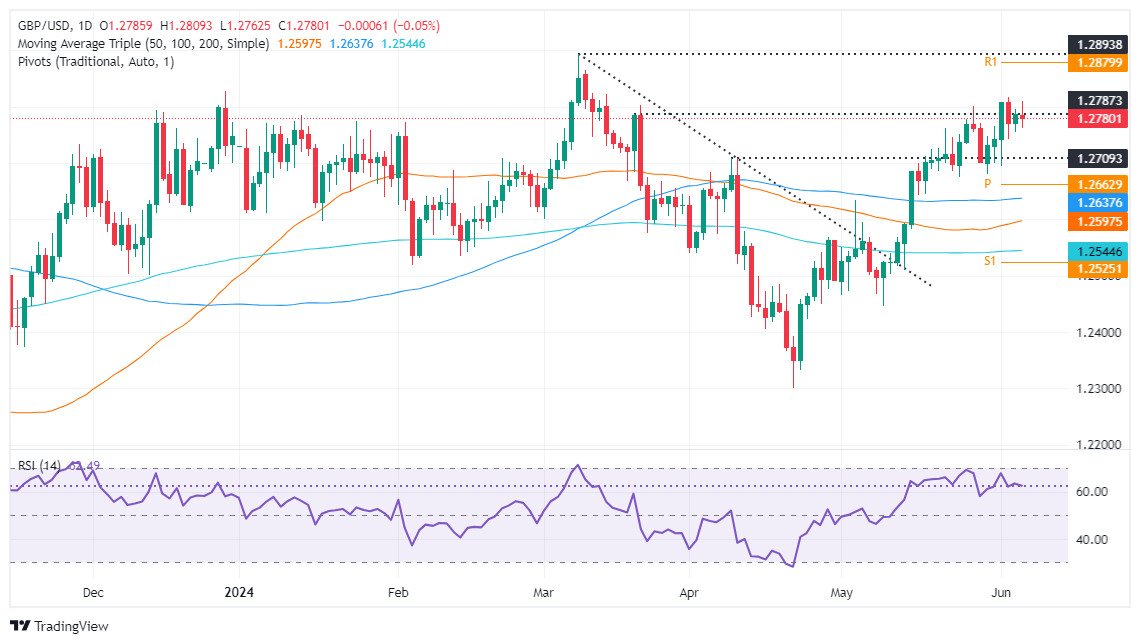
The GBP/USD is consolidated and remains near the weekly highs but beneath 1.2800. Although the pair tested the latter, the pair seems reluctant to a decisive break above that level that could push prices to the year-to-date (YTD) high of 1.2894.

Even though momentum favors buyers, as depicted by the Relative Strength Index (RSI), sellers are gaining traction as the RSI aims downwards.

That said, if GBP/USD drops below the June 5 low of 1.2755, it will expose the next cycle low seen at 1.2694, the June 3 low. On the other hand, if buyers lift the exchange rate past 1.2800, the next resistance would be the June 4 daily high of 1.2817 before testing the year-to-date (YTD) high of 1.2893.

GBP/USD Price Action – Daily Chart

GBP/USD

Overview
Today last price1.2774
Today Daily Change-0.0012
Today Daily Change %-0.09
Today daily open1.2786
 
Trends
Daily SMA201.2695
Daily SMA501.2594
Daily SMA1001.2637
Daily SMA2001.2544
 
Levels
Previous Daily High1.2795
Previous Daily Low1.2756
Previous Weekly High1.2801
Previous Weekly Low1.2681
Previous Monthly High1.2801
Previous Monthly Low1.2446
Daily Fibonacci 38.2%1.278
Daily Fibonacci 61.8%1.2771
Daily Pivot Point S11.2763
Daily Pivot Point S21.2739
Daily Pivot Point S31.2723
Daily Pivot Point R11.2802
Daily Pivot Point R21.2819
Daily Pivot Point R31.2842

Author

Christian Borjon Valencia

Markets analyst, news editor, and trading instructor with over 14 years of experience across FX, commodities, US equity indices, and global macro markets.

More from Christian Borjon Valencia
Share:

Editor's Picks

AUD/USD falls to near 0.7100 after slipping below 50-day EMA

AUD/USD depreciates after registering minor gains in the previous day, trading around 0.7120 during the Asian hours. The technical analysis of the daily chart shows the pair consolidating sideways within a rectangle pattern, as neither bulls nor bears gain control. The AUD/USD pair is holding a slight bearish tone however as it sits beneath both the nine-day and 50-day EMAs.

160.00: USD/JPY back near intervention territory after upbeat US jobs report

US Nonfarm Payrolls beat expectations by a wide margin in May, with 172K jobs added. The US Dollar rebounds after the release, helping USD/JPY recover from its intraday lows. Warnings from Japanese authorities continue to limit upside potential near the 160.00 threshold.

Gold targets $4,300 amid stronger Dollar

Gold faces increasing selling interest and navigates the area of three-month lows near the $4,300 mark per troy ounce on Friday. The precious metal’s decline comes as traders assess the stronger-than-expected NFP, while the bid bias in the Greenback and higher US Treasury yields also collaborate with the retracement.

Cardano hits five-year low even as Hoskinson clarifies "break" isn't an exit

Cardano (ADA) price is down 10% at press time on Friday, extending losses over 30% so far this week amid Charles Hoskinson's clarification that "break" isn't an exit.

Week ahead – Fed countdown begins amid US inflation data and geopolitical risks

Fed Chair Warsh’s first meeting approaches as key US inflation data could reshape expectations. Oil prices remain elevated as US-Iran talks continue; tariffs also return to the spotlight. ECB is expected to hike; will it be a one-off move or is July live?

The US economy defies the rules: 100 days into the Oil shock and the recession signal is still missing

More than three months after the start of the Iran war and the resulting disruption to global energy markets, the US economy continues to display remarkable resilience. The conflict has triggered a sharp rise in Oil prices, reignited inflationary pressures and fueled widespread concerns about a potential economic slowdown.