|

GBP/USD Price Analysis: Consecutive Dojis indicate indecisiveness

  • GBP/USD has stretched its recovery above 1.2440 as USD Index is struggling to defend its four-day support.
  • BoE Ramsden warned that the central bank must stop the risk of high inflation becoming embedded in the economy.
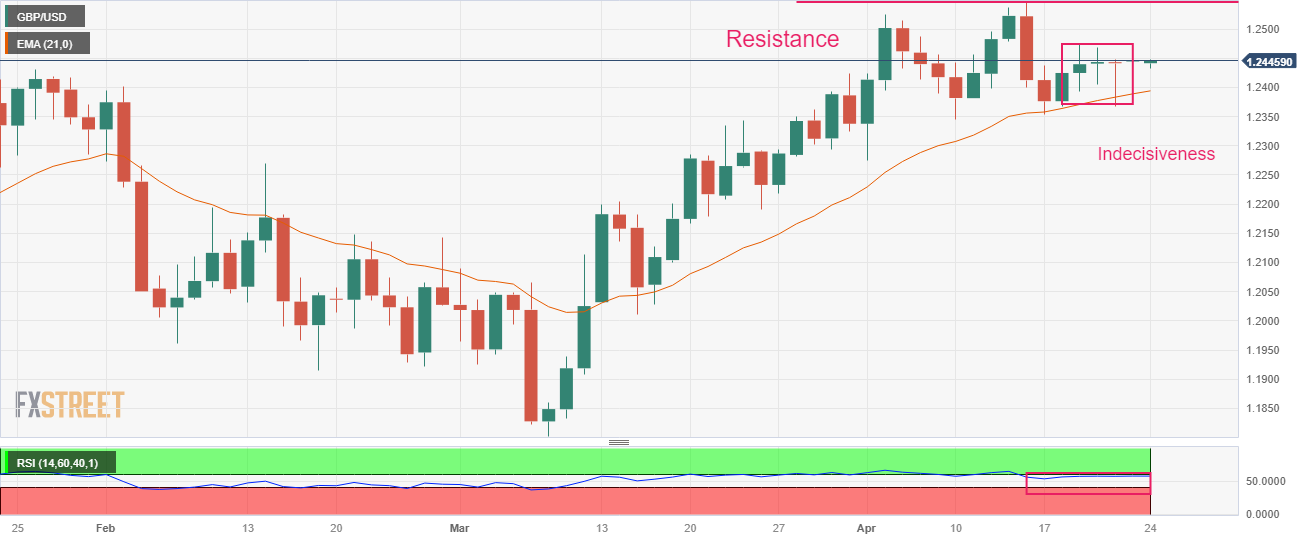
  • Consecutive Doji formations by GBP/USD indicate a sheer contraction in volatility.

The GBP/USD pair has rebounded sharply above 1.2440 in the early Tokyo session. The Cable is looking to extend its recovery ahead as investors are very much confident of further rate hikes from the Bank of England (BoE).

BoE Deputy Governor Dave Ramsden said in an interview with The Times that the central bank must stop the risk of high inflation becoming embedded in the economy. He added there were still signs of stubbornly high inflation. However, the United Kingdom Retail Sales data landed on Friday contracted more than expected. Monthly (March) Retail Sales data contracted by 0.9% while the street was anticipating a contraction of 0.5%. UK’s stubborn inflation has heavily impacted households’ retail demand.

Meanwhile, S&P500 futures are showing some losses in the early Asian session after a choppy Friday. Investors are witnessing a stock-specific action amid the quarterly earnings season, keeping investors risk-averse. The US Dollar Index (DXY) is struggling to defend the crucial support of 101.70.

Consecutive Doji candlesticks formation on the daily scale by GBP/USD indicates a sheer contraction in volatility. The Cable is struggling to find decisive movements amid an absence of a potential trigger. The 20-period Exponential Moving Average (EMA) at 1.2395 is providing cushion to the Pound Sterling.

Meanwhile, the Relative Strength Index (RSI) (14) has shown a loss in the upside momentum and has shifted into the 40.00-60.00 range.

Further stretch in recovery above April 13 high at 1.2537 will drive the asset towards a fresh 10-month high at 1.2597, which is 08 June 2022 high. A breach of the latter will expose the asset to May 27 high at 1.2667.

On the flip side, a slippage below April 10 low at 1.2345 will expose the asset to March 30 low at 1.2294 followed by March 27 low at 1.2219.

GBP/USD daily chart

GBP/USD

Overview
Today last price1.2446
Today Daily Change0.0005
Today Daily Change %0.04
Today daily open1.2441
 
Trends
Daily SMA201.2413
Daily SMA501.221
Daily SMA1001.2198
Daily SMA2001.1927
 
Levels
Previous Daily High1.2448
Previous Daily Low1.2367
Previous Weekly High1.2474
Previous Weekly Low1.2354
Previous Monthly High1.2424
Previous Monthly Low1.1803
Daily Fibonacci 38.2%1.2398
Daily Fibonacci 61.8%1.2417
Daily Pivot Point S11.239
Daily Pivot Point S21.2338
Daily Pivot Point S31.2308
Daily Pivot Point R11.2471
Daily Pivot Point R21.25
Daily Pivot Point R31.2552

Author

Sagar Dua

Sagar Dua

FXStreet

Sagar Dua is associated with the financial markets from his college days. Along with pursuing post-graduation in Commerce in 2014, he started his markets training with chart analysis.

More from Sagar Dua
Share:

Editor's Picks

EUR/USD stays defensive below 1.1900 as USD recovers

EUR/USD trades in negative territory for the third consecutive day, below 1.1900 in the European session on Thursday. A modest rebound in the US Dollar is weighing on the pair, despite an upbeat market mood. Traders keep an eye on the US weekly Initial Jobless Claims data for further trading impetus. 

GBP/USD holds above 1.3600 after UK data dump

\GBP/USD moves little while holding above 1.3600 in the European session on Thursday, following the release of the UK Q4 preliminary GDP, which showed a 0.1% growth against a 0.2% increase expected. The UK industrial sector activity deteriorated in Decembert, keeping the downward pressure intact on the Pound Sterling. 

Gold sticks to modest intraday losses as reduced March Fed rate cut bets underpin USD

Gold languishes near the lower end of its daily range heading into the European session on Thursday. The precious metal, however, lacks follow-through selling amid mixed cues and currently trades above the $5,050 level, well within striking distance of a nearly two-week low touched the previous day.

Cardano eyes short-term rebound as derivatives sentiment improves

Cardano (ADA) is trading at $0.257 at the time of writing on Thursday, after slipping more than 4% so far this week. Derivatives sentiment improves as ADA’s funding rates turn positive alongside rising long bets among traders.

A tale of two labour markets: Headline strength masks underlying weakness

Undoubtedly, yesterday’s delayed US January jobs report delivered a strong headline – one that surpassed most estimates. However, optimism quickly faded amid sobering benchmark revisions.

Sonic Labs’ vertical integration fuels recovery in S token

Sonic, previously Fantom (FTM), is extending its recovery trade at $0.048 at the time of writing, after rebounding by over 12% the previous day. The recovery thesis’ strengths lie in the optimism surrounding Sonic Labs’ Wednesday announcement to shift to a vertically integrated model, aimed at boosting S token utility.