GBP/USD Price Analysis: Choppy trading conditions leave the pair without a bias
- GBP/USD in a chop as the bulls and bears battle it out within familiar ranges.
- Bulls need to get above 1.3110 for the near term.

GBP/USD is stuck in ranges across the time frames without a clear bias one way or the other. The following illustrates this across the weekly, daily and hourly time frame.
GBP/USD daily chart
As illustrated above, the price has run into the neckline of the formation, a move that was telegraphed in the prior day's analysis as follows:
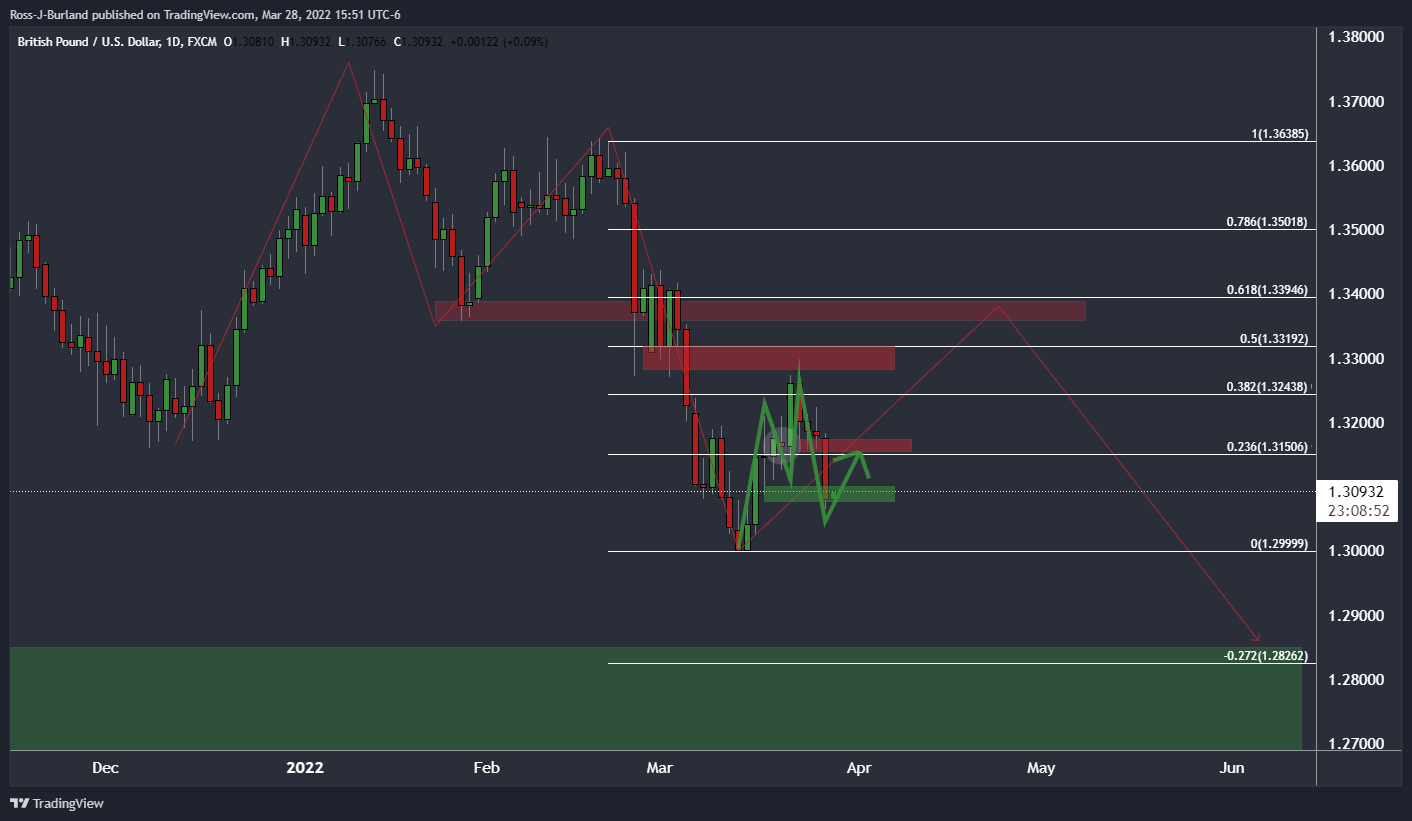
''The price, however, is being held up at what could be a support zone on the daily chart. This is an old area of resistance and an M-formation could be marked so long as the forthcoming sessions are bullish.''
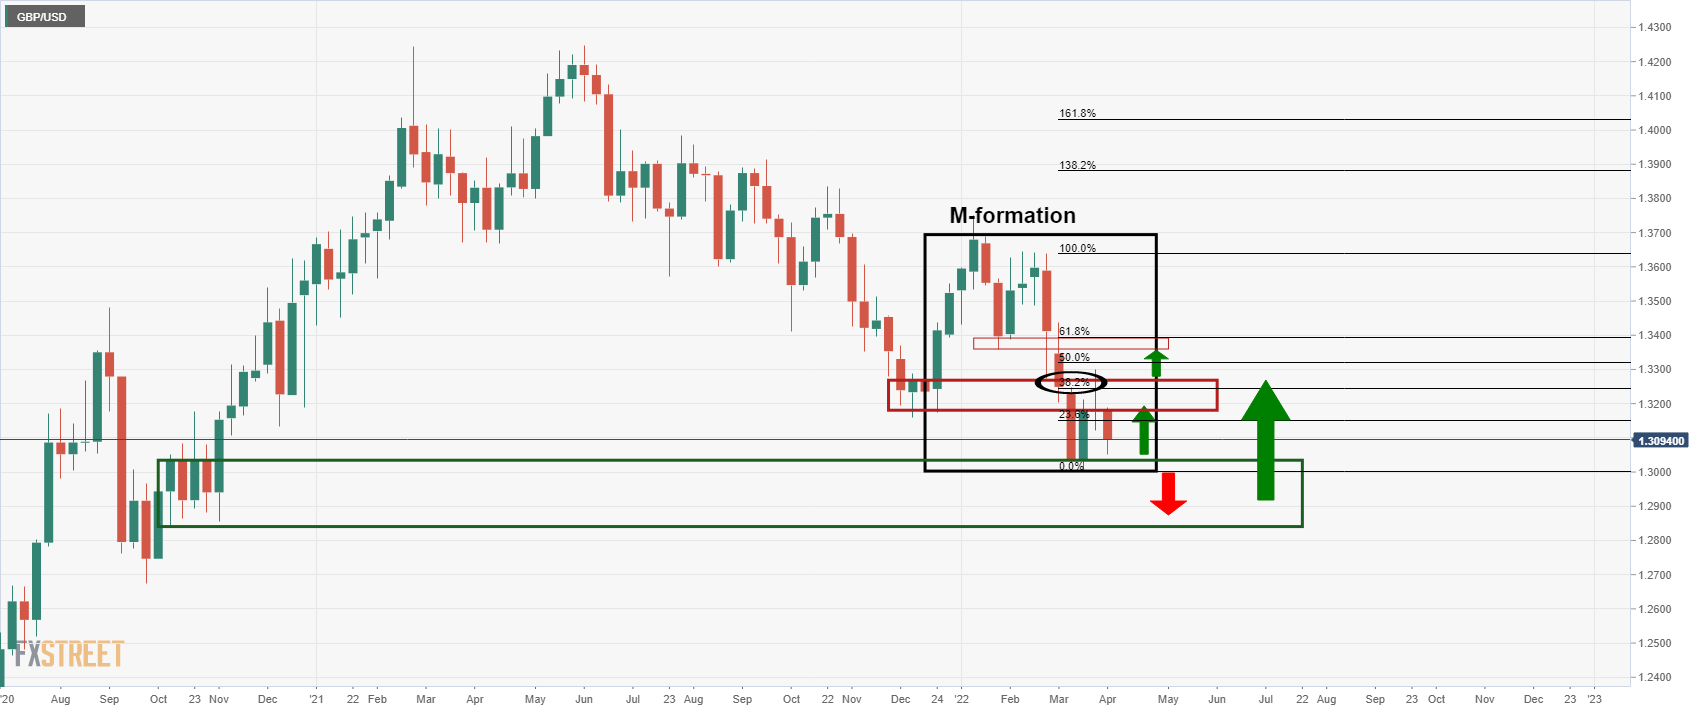
The analysis is fractal in nature and part of a long-term projection as per the weekly chart:
GBP/USD weekly chart
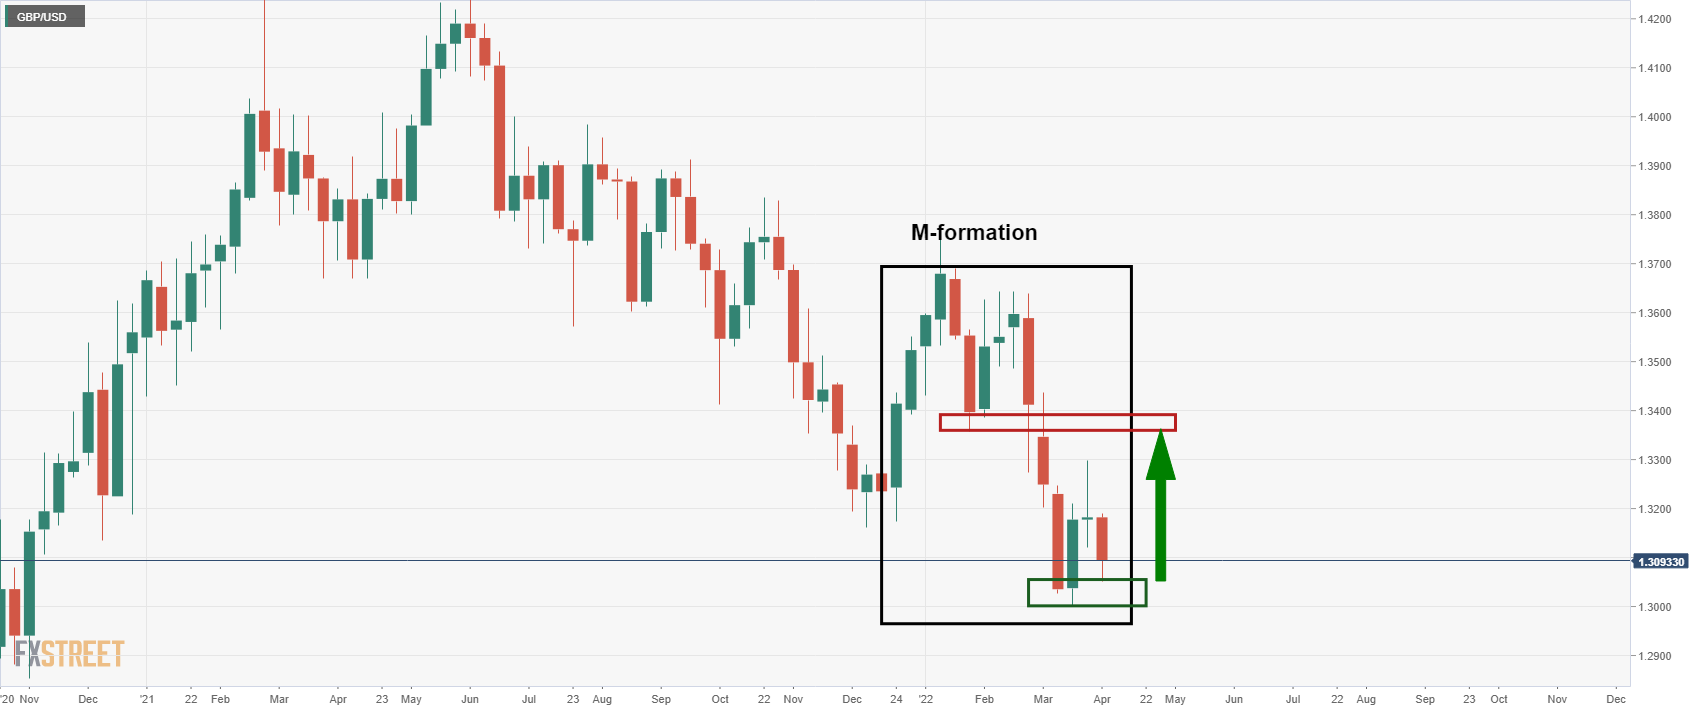
While the current week's candle is strongly bearish and arguably engulfing following the weekly dojo candle of last week, there is still time until the close for the price to move higher and even close bullish. However, this would be going against the grain in the futures market as short positions increased for the third week. Additionally, the price has already reached a 38.2% Fibonacci retracement level and prior support of December 2021. Therefore, there is a lot of work to come from the bulls:
Instead, we could see the price break the recent lows and mitigate the imbalance left behind from the summer of 2020 down in the 1.28 areas.
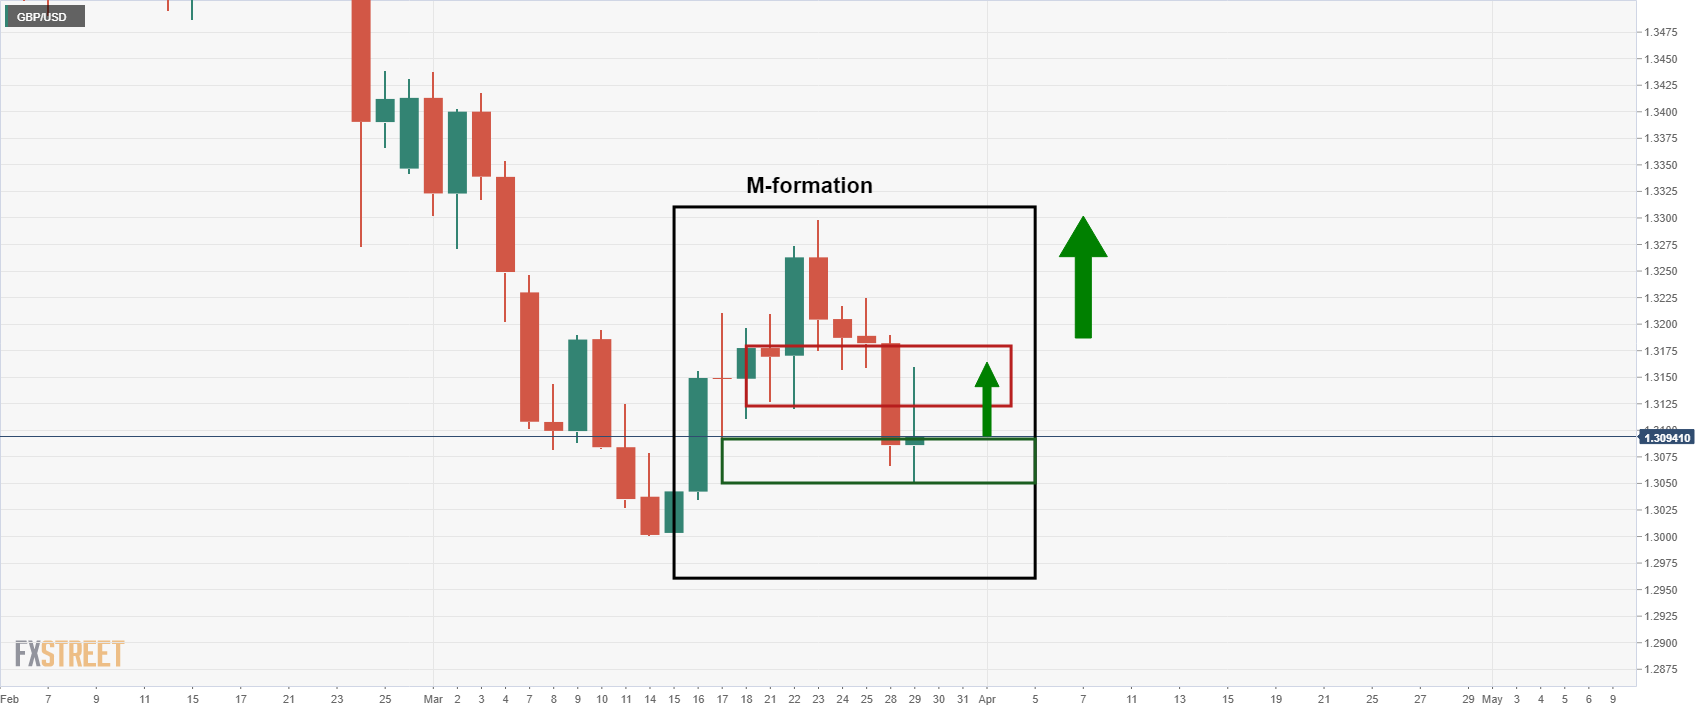
For the very near term, however, there is an M-formation on the hourly chart:
GBP/USD H1 chart
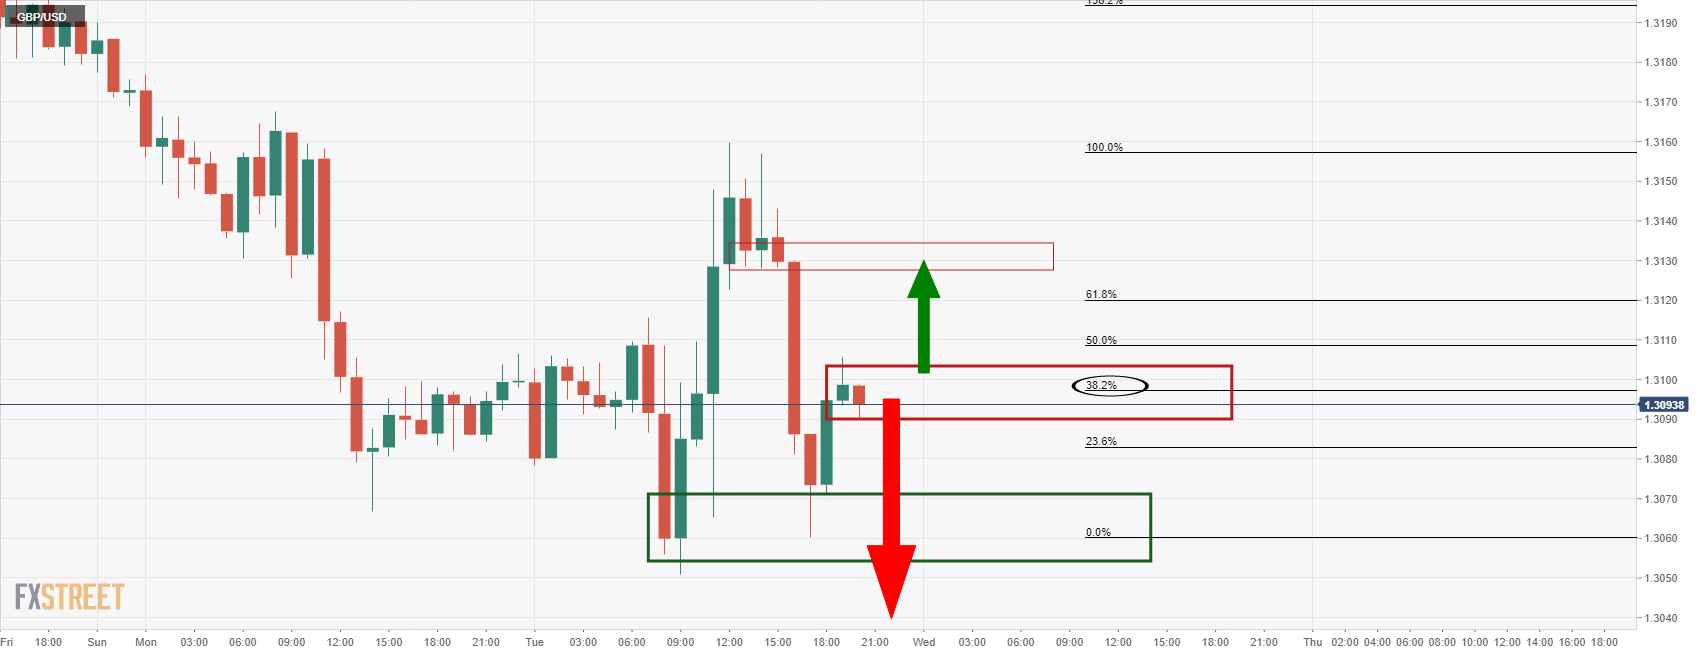
As seen, the price here has also made a 38.2% Fibo retracement from where the bears appear to be engaging from. However, should there be a move beyond the highs in the 1.3110 area, then the neckline of the formation would be expected to come under pressure near 1.3130.
Author

Ross J Burland
FXStreet
Ross J Burland, born in England, UK, is a sportsman at heart. He played Rugby and Judo for his county, Kent and the South East of England Rugby team.


