|

GBP/USD Price Analysis: Cable dribbles around resistance-turned-support near 1.2770 ahead of UK inflation

  • GBP/USD pauses corrective bounce off one-week low after two-day losing streak as UK inflation data looms.
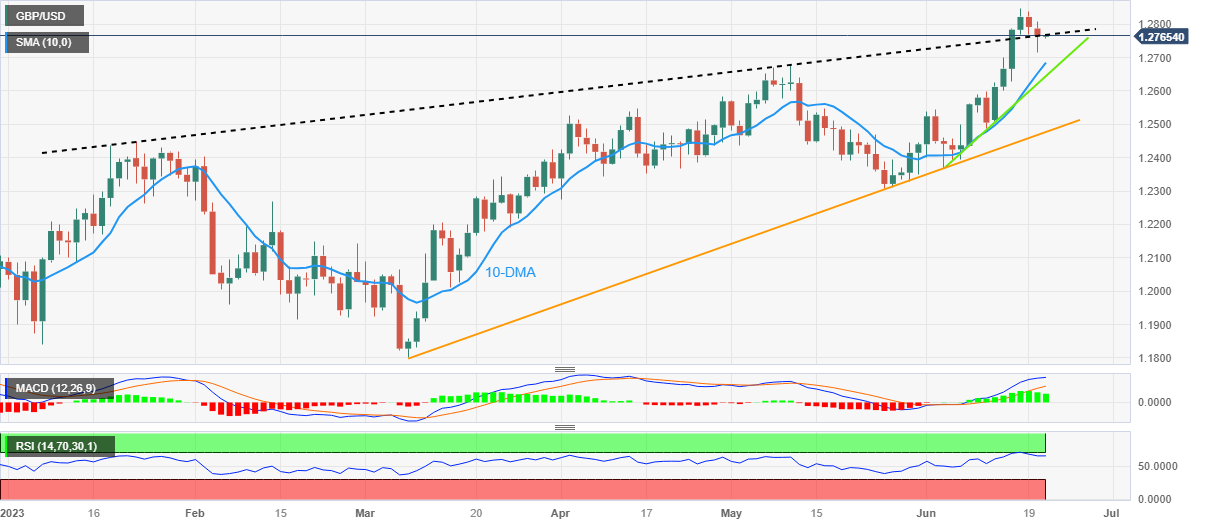
  • Overbought RSI suggests further grinding of Cable prices toward the south but 10-DMA, May’s peak can prod bears.
  • Pound Sterling needs clear break of 1.2850 and upbeat UK CPI to aim for the 1.3000 psychological magnet.
GBP/USD Price Analysis: Cable dribbles around resistance-turned-support near 1.2770 ahead of UK inflation

GBP/USD fades corrective bounce off weekly low as it retreats to 1.2760 amid the early hours of Wednesday’s Asian session, sidelined of late. In doing so, the Cable pair inability to defend the previous week’s upside break of a five-month-old resistance line amid the overbought RSI conditions. It’s worth noting that the Pound Sterling’s latest inaction could be linked to the market’s cautious mood ahead of the UK’s top-tier inflation clues including the Consumer Price Index (CPI) for May.

Also read: GBP/USD retraces below 1.2800 on a strong USD, ahead of Powell testimony, BoE’s decision

Given the overbought RSI (14) line and the Cable pair’s inability to stay beyond the key resistance line, the GBP/USD bears are well-set to extend the previous two-day downtrend. However, the previous monthly high join the 10-DMA to highlight the 1.2685-80 region as the short-term key support zone for them to conquer to tighten the grip.

Also acting as a short-term downside filter is an upward-sloping trend line from June 05, close to 1.2645 by the press time.

In a case where the GBP/USD pair breaks the 1.2645 support, the early June swing high of near 1.2545 will precede a 3.5-month-old ascending support line, close to 1.2475, to please the bears before directing them to the January 2023 peak of near 1.2450.

On the contrary, GBP/USD recovery needs to cross the latest monthly peak of around 1.2850 to aim for the early April 2022 low of near 1.2975-80.

Following that, the 1.3000 psychological magnet may act as an extra check for the Pound Sterling bulls before giving them control.

GBP/USD: Daily chart
Trend: Further downside expected

Additional important levels

Overview
Today last price1.2764
Today Daily Change-0.0028
Today Daily Change %-0.22
Today daily open1.2792
 
Trends
Daily SMA201.2513
Daily SMA501.25
Daily SMA1001.2328
Daily SMA2001.2051
 
Levels
Previous Daily High1.2837
Previous Daily Low1.277
Previous Weekly High1.2848
Previous Weekly Low1.2487
Previous Monthly High1.268
Previous Monthly Low1.2308
Daily Fibonacci 38.2%1.2796
Daily Fibonacci 61.8%1.2812
Daily Pivot Point S11.2762
Daily Pivot Point S21.2733
Daily Pivot Point S31.2696
Daily Pivot Point R11.2829
Daily Pivot Point R21.2866
Daily Pivot Point R31.2896

Author

Anil Panchal

Anil Panchal

FXStreet

Anil Panchal has nearly 15 years of experience in tracking financial markets. With a keen interest in macroeconomics, Anil aptly tracks global news/updates and stays well-informed about the global financial moves and their implications.


More from Anil Panchal
Share:

Editor's Picks

AUD/USD bears retain control near YTD low, 0.6650 tested

AUD/USD sits at fresh YTD lows near 0.6550 in Friday's Asian session and looks vulnerable to further downside. The US Dollar holds near April 2025 highs amid renewed US-Iran tensions and aggressive Fed rate-hike bets. Moreover, Thursday’s dismal Aussie jobs data, the RBA’s dovish tilt and PBOC's status-quo continue to weigh on the Aussie, validating the negative outlook for the currency pair.

USD/JPY flatlines above mid-159.00s; moves little after Japan’s National CPI

USD/JPY holds above mid-159.00s in the Asian session on Friday, reacting little to Japan’s National CPI, which reaffirmed December BoJ rate hike. However, the uncertainty over the BoJ’s future policy path continues to undermine the Japanese Yen. Moreover, hawkish Fed and renewed US-Iran tensions keep the US Dollar firm near a 19-month low, supporting the pair despite looming intervention risks.


Gold extends sell-off below $3,600 on hawkish Fed repricing

Gold hits a fresh low since September 2025, falling further below $3,600 in the Asian session on Friday amid extremely oversold conditions. Aggressive Fed rate hike bets act as a headwind for the non-yielding bullion. Moreover, fears of renewed US-Iran tensions keep the safe-haven US Dollar firm near a 19-month peak, which exacerbated Gold's pain.

Bitcoin slides below $62,000, AI tokens outperform following Anthropic IPO

Bitcoin and the broader crypto market extended losses on Thursday following Anthropic's record-breaking initial public offering, while AI-related tokens remained resilient, posting gains despite weakness across major digital assets. The top crypto fell below $62,000 after Anthropic's stock market debut.

Gold's 14-month low looks mild next to Silver's fall from $121 to $44
Gold has lost a third of its value since January as traders bet on more Federal Reserve rate increases. Silver has lost nearly two-thirds, because the buyers still holding Gold up have no equivalent in the Silver market. Gold is trading below $3,700 for the first time since September 2025, a little more than a third under the record near $5,600 it set in late January.
Gold's 14-month low looks mild next to Silver's fall from $121 to $44
Gold has lost a third of its value since January as traders bet on more Federal Reserve rate increases. Silver has lost nearly two-thirds, because the buyers still holding Gold up have no equivalent in the Silver market. Gold is trading below $3,700 for the first time since September 2025, a little more than a third under the record near $5,600 it set in late January.














