|

GBP/USD Price Analysis: Cable buyers prod key resistance near 1.2720, Fed inflation eyed

  • GBP/USD prods one-month-old descending resistance line at weekly top.
  • Looming bull cross on MACD, steady RSI joins higher high formation to favor Cable bulls.
  • 50-DMA acts as additional upside filter for the Pound Sterling buyers to cross.
  • Pullback needs validation from five-month-old horizontal support zone.

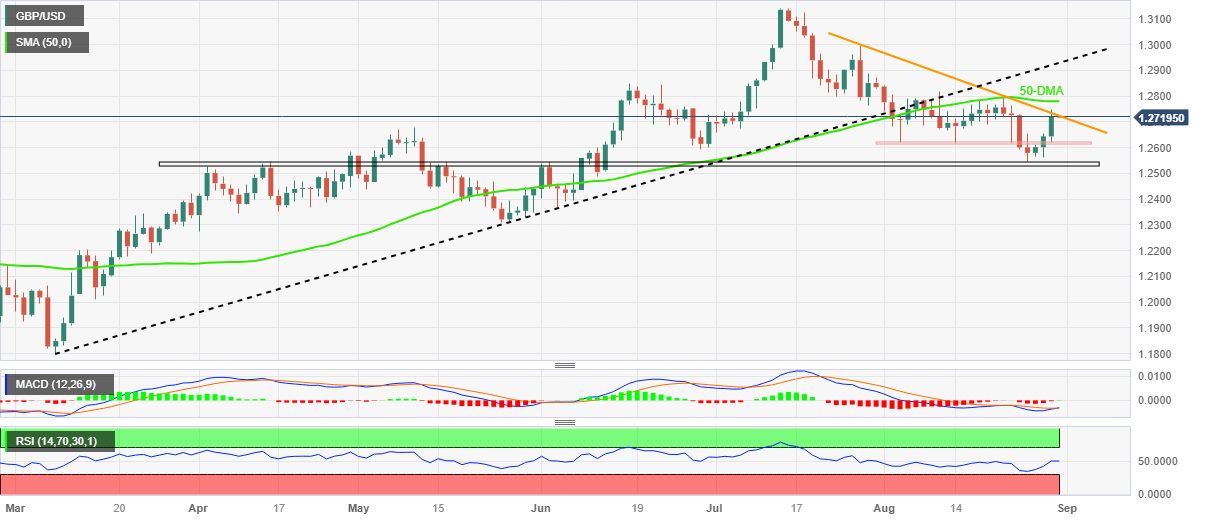
GBP/USD buyers attack a downward-sloping resistance line from late July as they await the key US inflation gauge while pausing the three-day uptrend amid early Thursday morning in Asia. In doing so, the Cable pair seesaws around the 1.2720 level while defending the previous week’s rebound from a five-month-old horizontal support zone.

Not only a clear rebound from the key horizontal support but the impending bull cross on the MACD and the steady RSI (14) line also keep the GBP/USD buyers hopeful.

With this, the Pound Sterling is likely to cross the 1.2720 upside hurdle.

However, the 50-DMA level of 1.2780 acts as the last defense of the GBP/USD bears before giving control to the buyers.

Following that, a run-up towards the previous support line stretched from early March, close to 1.2930, and then to the 1.3000 psychological magnet can’t be ruled out.

On the flip side, the GBP/USD pair’s pullback may aim for the monthly horizontal area surrounding 1.2620–15 before revisiting the horizontal area comprising multiple levels marked since early April, close to 1.2545–30.

In a case where the Cable pair drops below 1.2530, it becomes vulnerable to decline toward May’s bottom of around 1.2310.

GBP/USD: Daily chart
Trend: Further upside expected

Additional important levels

Overview
Today last price1.2719
Today Daily Change0.0075
Today Daily Change %0.59%
Today daily open1.2644
 
Trends
Daily SMA201.2702
Daily SMA501.2782
Daily SMA1001.2644
Daily SMA2001.2407
 
Levels
Previous Daily High1.2655
Previous Daily Low1.2563
Previous Weekly High1.28
Previous Weekly Low1.2548
Previous Monthly High1.3142
Previous Monthly Low1.2659
Daily Fibonacci 38.2%1.262
Daily Fibonacci 61.8%1.2598
Daily Pivot Point S11.2586
Daily Pivot Point S21.2528
Daily Pivot Point S31.2494
Daily Pivot Point R11.2678
Daily Pivot Point R21.2713
Daily Pivot Point R31.277

Author

Anil Panchal

Anil Panchal

FXStreet

Anil Panchal has nearly 15 years of experience in tracking financial markets. With a keen interest in macroeconomics, Anil aptly tracks global news/updates and stays well-informed about the global financial moves and their implications.


More from Anil Panchal
Share:

Editor's Picks

GBP/USD hits multi-week tops around 1.3560

GBP/USD gathers fresh steam and advances to new three-month peaks near the 1.3560 zone on Friday. Cable’s sharp move higher comes after three daily drops in a row and follows the increasing selling pressure hurting the Greenback.

EUR/USD pops to fresh two-month highs, targets 1.1600

EUR/USD advances markedly, revisiting the upper 1.1500s for the first time since mid-June. The pair’s sharp uptick comes on the back of a strong retracement in the US Dollar amid BoJ intervention chatter and despite steady uncertainty in the Middle East.

Gold retakes $4,400 as receding Fed hike bets undermine USD

Gold is looking to build on Friday's bounce from the $4,300 neighborhood as reduced bets on an immediate Fed rate hike keep US Dollar bulls on the defensive and support the non-yielding bullion. However, the US-Iran standoff could limit deeper USD losses, warranting caution before positioning for the resumption of the XAU/USD pair's recent uptrend to its highest level since June 5.

BTC/USD price outlook: Bitcoin navigating between arc levels. Potential continuation toward $58,000
Overview: Based on Arc Cycle Analysis applied to the 1D chart, Bitcoin is trading between the 0.5 Arc and 0.618 Arc within the current Arc Cycle. Price has cleared the 0.5 Arc and is progressing toward the 0.618 Arc, suggesting continued movement toward the next Arc boundary. Metric
US Dollar Weekly Forecast: Economic cracks challenge Fed rate bets

It was a strange week for the US Dollar: while the geopolitical situation has remained largely unchanged, with the usual back-and-forth between the US, Iran, and occasional third parties, disappointing domestic data have re-emerged, reducing expectations of potential tightening by the Federal Reserve in the next few months.

Why is Crude Oil priced for a reopening the ships haven't made?
Fourteen vessels crossed the Strait of Hormuz on Tuesday. Before the war, the count ran near 120 a day. In the sessions since the waterway was publicly declared open, Brent has drifted back to $87 and West Texas Intermediate (WTI) to $81, both a little lower again on Wednesday, with daily momentum on each unwound from the top of its range in late July to the low twenties now.














