|

GBP/USD Price Analysis: Cable bears need validation from 1.2500 and UK GDP to keep the reins

  • GBP/USD licks its wounds after posting the biggest daily loss in seven weeks.
  • Downside break of two-month-old ascending trend line, bearish MACD signals favor Cable bears.
  • Nearly oversold RSI (14), upward-sloping trend line from late March challenges the Pound Sterling sellers.
  • First readings of the United Kingdom (UK) Gross Domestic Product (GDP) for the first quarter (Q1) of 2023 eyed as well.

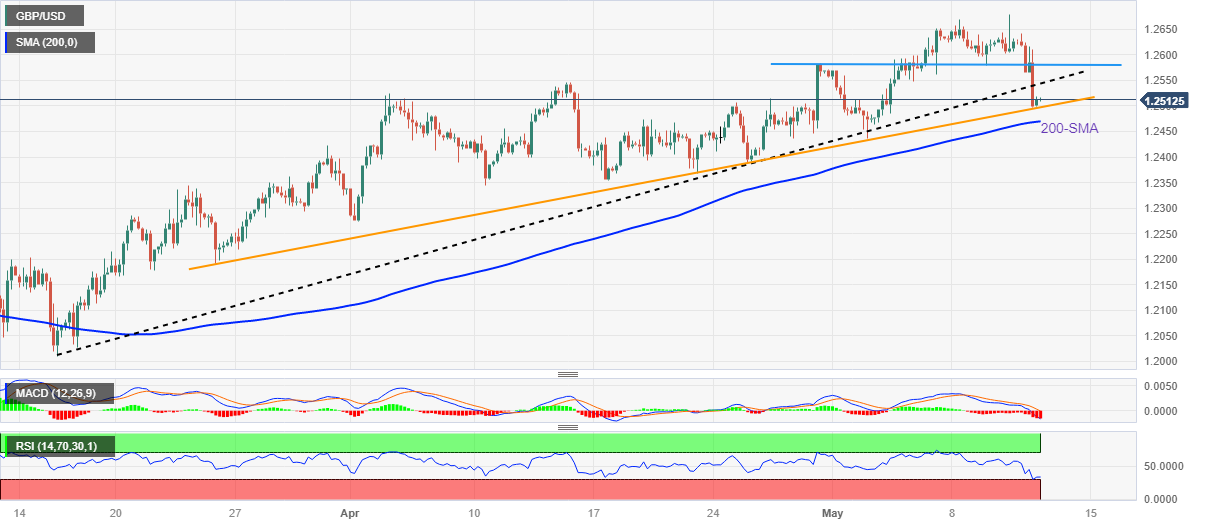
GBP/USD seesaws around 1.2515 during early Friday morning in Asia, after posting the biggest daily fall since March 07.

In doing so, the Cable pair justifies the downside break of a two-month-old ascending trend line, as well as bearish MACD signals. However, an upward-sloping trend line from late March, around 1.2500 round figure by the press time, joins the oversold RSI (14) line suggesting a corrective bounce in the GBP/USD price.

In a case where the GBP/USD remains weaker past 1.2500, the 200-bar SMA level of around 1.2470 will act as the last defense of the Cable pair buyers.

Meanwhile, the Pound Sterling’s corrective bounce needs to stay beyond the multi-day-old previous support line, close to 1.2540 at the latest, to convince the GBP/USD buyers.

Following that, a fortnight-old horizontal hurdle near 1.2580 and the recently flashed multi-month high of near 1.2680 could lure the Cable buyers.

Apart from the technical details, the first readings of the UK’s Q1 GDP, expected to print stagnant growth of 0.1% on QoQ but ease to 0.2% YoY versus 0.6% prior, will be the key for the GBP/USD traders to watch for clear directions.

GBP/USD: Four-hour chart

Trend: Limited downside expected

additional important levels

Overview
Today last price1.2512
Today Daily Change-0.0114
Today Daily Change %-0.90%
Today daily open1.2626
 
Trends
Daily SMA201.2504
Daily SMA501.2337
Daily SMA1001.224
Daily SMA2001.1957
 
Levels
Previous Daily High1.268
Previous Daily Low1.2603
Previous Weekly High1.2652
Previous Weekly Low1.2436
Previous Monthly High1.2584
Previous Monthly Low1.2275
Daily Fibonacci 38.2%1.265
Daily Fibonacci 61.8%1.2632
Daily Pivot Point S11.2592
Daily Pivot Point S21.2559
Daily Pivot Point S31.2515
Daily Pivot Point R11.2669
Daily Pivot Point R21.2713
Daily Pivot Point R31.2747

Author

Anil Panchal

Anil Panchal

FXStreet

Anil Panchal has nearly 15 years of experience in tracking financial markets. With a keen interest in macroeconomics, Anil aptly tracks global news/updates and stays well-informed about the global financial moves and their implications.

More from Anil Panchal
Share:

Editor's Picks

EUR/USD slumps below 1.1750 as USD benefits from risk-aversion

EUR/USD comes under renewed bearish pressure in the European session and trades below 1.1750 following a recovery attempt earlier in the day. The US Dollar gathers strength and weighs on the pair as investors seek refuge in the wake of Israel and the United States' joint attack on Iran.

GBP/USD targets 1.3500 barrier near moving averages

GBP/USD rebounds from the daily losses, trading around 1.3450 during the Asian hours on Monday. The technical analysis of the daily chart indicates an ongoing bearish bias, as the pair trades within a descending channel pattern.

Gold surges on safe-haven demand, rises above $5,400

Gold benefits from intense risk-aversion on Monday and climbs above $5,400, setting a fresh monthly-high in the process. Tensions in the Middle East remain high as Israel and Hezbollah continue to exchange strikes following the US-Israel joint attack on Iran over the weekend.

Bitcoin, Ethereum and Ripple under pressure as key supports face breakdown risk

Bitcoin, Ethereum, and Ripple prices trade on the back foot at the start of this week on Monday, after extending losses in the previous week. BTC is on the brink of a breakdown, ETH is capped below key resistance, and XRP risks a crack of the trendline.

The market is paying for insurance, not apocalypse

As expected, this morning felt less like a Monday market open and more like a fire drill. Futures screens flickered red. S&P contracts down almost 1%. Nasdaq off 1.2%. Brent leaped 13% through $80. Gold rose 1.6% toward $5350 before paring some gains. The dollar is strutting mildly. The Swiss franc is quietly doing what it always does in a storm, catching some safe-haven flows.

Pi Network Price Forecast: Core team offloads supply, weighing on PI recovery

Pi Network  hovers below $0.1700, broadly steady at press time on Monday, attempting a recovery after a 2% loss the previous day. Sunday’s decline aligned with nearly 49 million PI tokens offloaded by the Pi Foundation, implying a spike in supply pressure that capped the prevailing four-day recovery.