|

GBP/USD Price Analysis: Bulls target breakout to old hourly support

  • GBP/USD bulls are taking charge on the shorter-term time frames but bears lurking. 
  • The price action is choppy as traders await the Fed, but technicals speak for themselves. 

The following is a top-down analysis that illustrates the bearish bias for the near/medium term compared to a  bullish bias longer term.

For the very immediate future, the bulls are taking charge and are on the verge of a breakout to the hourly resistance as shown below. 

Monthly chart

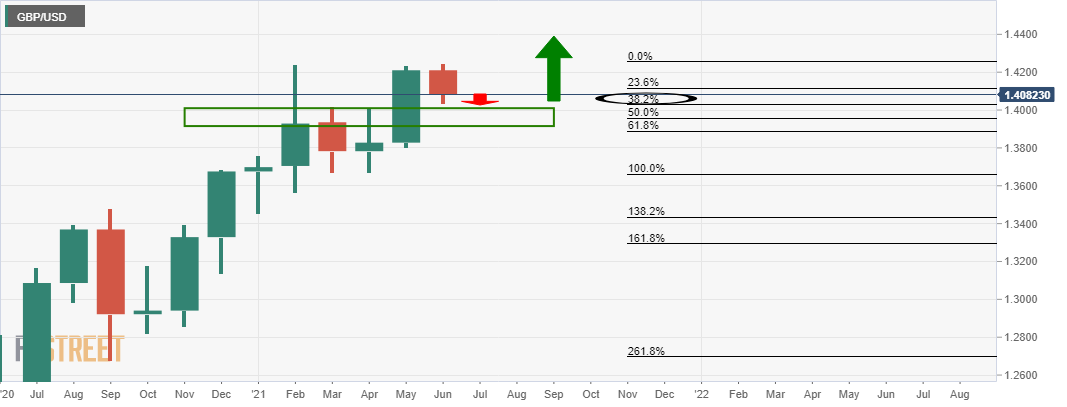
The monthly chart is bearish near term, bullish longer term.

A fuller test of the 38.2% Fibonarri is expected.

Weekly chart

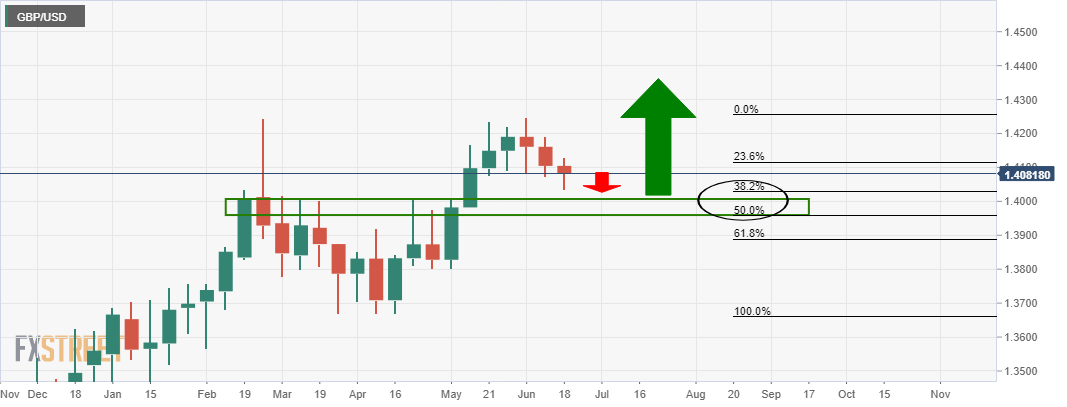
As the weekly chart illustrates, the bears are in control and there is space to go until the weekly old resistance s properly tested. 

Daily chart 

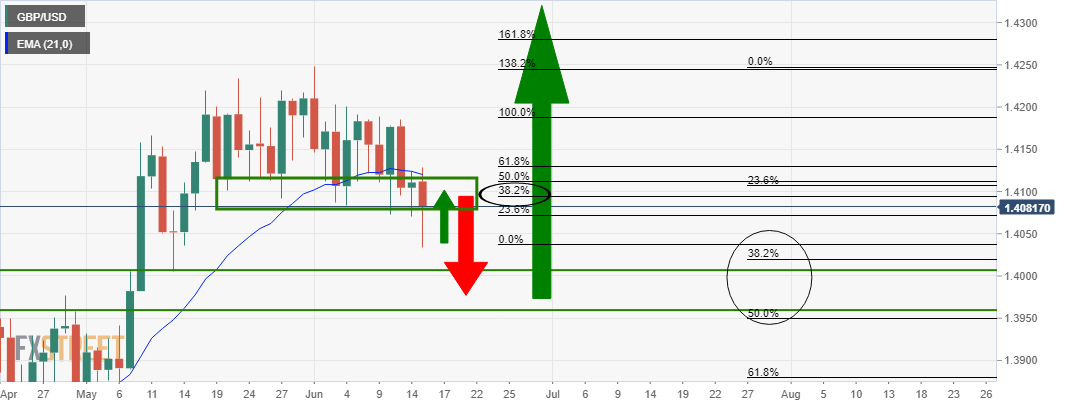
The daily chart illustrates that the bulls are attempting to test old support. 

Hourly chart

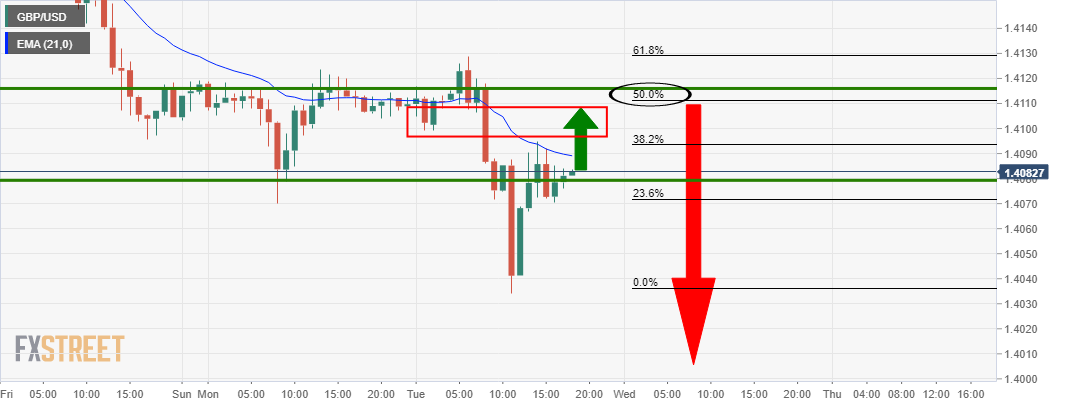
This gives rise to an imminent breakout on the hourly chart to test old hourly support for the hours ahead. 

Author

Ross J Burland

Ross J Burland, born in England, UK, is a sportsman at heart. He played Rugby and Judo for his county, Kent and the South East of England Rugby team.

More from Ross J Burland
Share:

Editor's Picks

AUD/USD consolidates above 0.7000/two-month low; bearish potential intact

The AUD/USD pair oscillates in a narrow range during the Asian session, and moves little following the release of mixed inflation figures from China. Spot prices currently trade around the 0.7025 region, nearly unchanged for the day, and remain within striking distance of a nearly two-month low set on Tuesday. Renewed hostilities between the US and Iran temper hopes for a deal to end the over three-month-old war.

Japanese Yen languishes despite wholesale inflation accelerates in May

USD/JPY flatlines after experiencing volatility, trading around 160.40 during the Asian hours on Wednesday. The pair continues to hold its ground, reflecting a struggling Japanese Yen that has failed to find support despite a massive acceleration in wholesale inflation. Driven by surging energy costs linked to the ongoing Middle East conflict, Japan’s Producer Price Index jumped 6.3% year-over-year in May. This hot printing comfortably outpaced April’s upwardly revised 5.3% figure and surpassed market consensus of 5.5%, marking the fastest pace of wholesale price growth in three years.

Gold plummets below $4,200 amid US‑Iran tensions ahead of US CPI

Gold extends the recent breakdown momentum below a technically significant 200-day Simple Moving Average (SMA) and drops to a fresh low since March 23, further below the $4,200 mark during the Asian session. Crude Oil prices rise amid renewed hostilities between the US and Iran, fueling inflation fears and bolstering bets for more hawkish central banks.

Bitcoin remains vulnerable, Ethereum weakens further, XRP signals more downside

Bitcoin, Ethereum, and Ripple remain under pressure mid-week, as the broader cryptocurrency market struggles to regain recovery momentum after last week’s massive correction. BTC struggles below $62,000, ETH continues to weaken below $1,650, while XRP’s momentum indicators remain biased toward further downside.

US CPI data set to show inflation at three-year high in May, backing Fed hawkish tilt

The US Bureau of Labor Statistics will publish the May Consumer Price Index (CPI) data on Wednesday. The report is expected to show another step up in consumer inflation, driven by the persistently high Oil prices due to the ongoing crisis in the Middle East.

The US economy defies the rules: 100 days into the Oil shock and the recession signal is still missing

More than three months after the start of the Iran war and the resulting disruption to global energy markets, the US economy continues to display remarkable resilience. The conflict has triggered a sharp rise in Oil prices, reignited inflationary pressures and fueled widespread concerns about a potential economic slowdown.