|

GBP/USD Price Analysis: Bulls run out of steam below 1.2390 resistance confluence

  • GBP/USD retreats from the highest levels since early February, snaps two-day uptrend.
  • Overbought RSI, bearish candlestick formation at multi-day top teases sellers.
  • Weekly support line holds the key for bear’s entry.
  • Previous support line from early March, two-week-long ascending trend line together challenges the bulls.

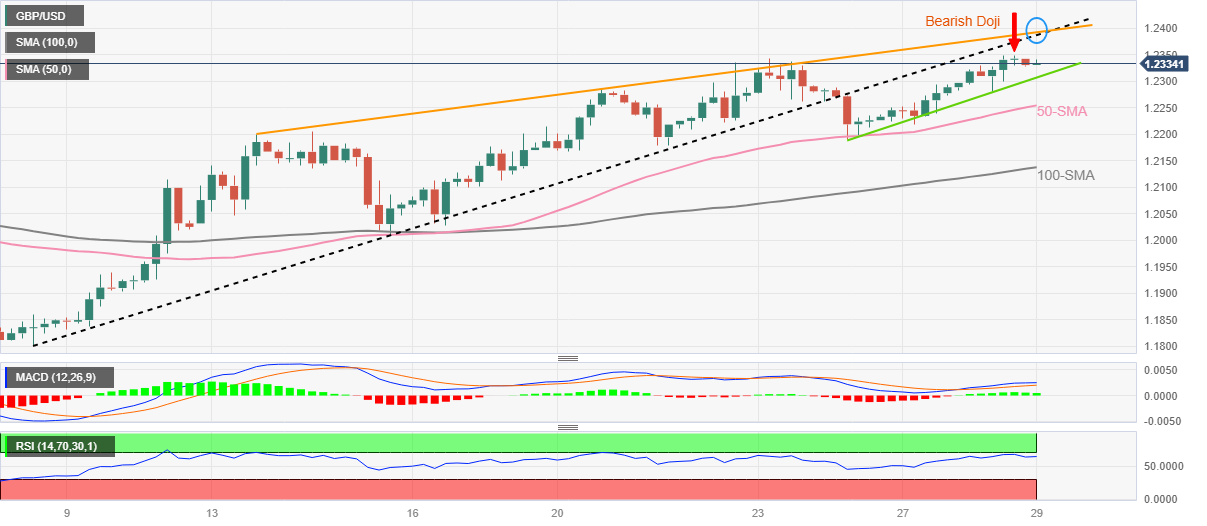
GBP/USD extends pullback from an eight-week high while printing mild losses near 1.2330 during early Wednesday. In doing so, the Cable pair prints the first daily loss in three.

Given the nearly overbought RSI (14), coupled with the bearish Doji candlestick at the multi-day top, the GBP/USD pair is likely to decline further.

However, an upward-sloping support line from the last Friday, around 1.2300 by the press time, restricts the short-term downside of the Cable pair.

Following that, the 50-SMA and the March 24 bottom, respectively near 1.2250 and 1.2190, could challenge the GBP/USD bears.

It’s worth noting that the 100-SMA level surrounding 1.2135 acts as the last defense of the GBP/USD buyers, a break of which won’t hesitate to prod the mid-month low of near the 1.2000 psychological magnet.

On the flip side, a convergence of the previous support line from March 08 and a fortnight-long ascending trend line, around 1.2390, challenges the GBP/USD buyers.

Even if the quote rises past 1.2390, multiple tops marked during late 2022 and early 2023, around 1.2445-50, appear a tough nut to crack for the Cable pair buyers.

To sum up, GBP/USD is likely bracing for a pullback but the reversal of the latest bullish trend is far from sight.

GBP/USD: Four-hour chart

Trend: Pullback expected

Additional important levels

Overview
Today last price1.2334
Today Daily Change-0.0008
Today Daily Change %-0.06%
Today daily open1.2342
 
Trends
Daily SMA201.2112
Daily SMA501.2151
Daily SMA1001.2108
Daily SMA2001.1894
 
Levels
Previous Daily High1.2349
Previous Daily Low1.2281
Previous Weekly High1.2344
Previous Weekly Low1.2167
Previous Monthly High1.2402
Previous Monthly Low1.1915
Daily Fibonacci 38.2%1.2323
Daily Fibonacci 61.8%1.2307
Daily Pivot Point S11.2299
Daily Pivot Point S21.2256
Daily Pivot Point S31.2231
Daily Pivot Point R11.2367
Daily Pivot Point R21.2392
Daily Pivot Point R31.2435

Author

Anil Panchal

Anil Panchal

FXStreet

Anil Panchal has nearly 15 years of experience in tracking financial markets. With a keen interest in macroeconomics, Anil aptly tracks global news/updates and stays well-informed about the global financial moves and their implications.

More from Anil Panchal
Share:

Markets move fast. We move first.

Orange Juice Newsletter brings you expert driven insights - not headlines. Every day on your inbox.

By subscribing you agree to our Terms and conditions.

Editor's Picks

EUR/USD edges above 1.1750 due to ECB-Fed policy divergence

EUR/USD has recovered its recent losses registered in the previous session, trading around 1.1760 during the Asian hours on Friday. Traders will likely observe Germany’s Manufacturing Purchasing Managers’ Index data later in the day.

GBP/USD gathers strength above 1.3450 on Fed rate cut bets, BoE's gradual policy path

The GBP/USD pair gathers strength to around 1.3480 during the early Asian session on Friday. Expectations of the US Federal Reserve rate cuts this year weigh on the US Dollar against the Pound Sterling. Philadelphia Fed President Anna Paulson is set to speak later on the weekend. 

Gold climbs to near $4,350 on Fed rate cut bets, geopolitical risks

Gold price rises to near $4,345 during the early Asian session on Friday. Gold finished 2025 with a significant rally, achieving an annual gain of around 65%, its biggest annual gain since 1979. The rally of the precious metal is bolstered by the prospect of further US interest rate cuts in 2026 and safe-haven flows.

Bitcoin trades in compression as 2026 begins with structure still unresolved

BTC/USD remains locked in a two-way structure, with micro supply-and-demand levels guiding early-year price behaviour.

Economic outlook 2026-2027 in advanced countries: Solidity test

After a year marked by global economic resilience and ending on a note of optimism, 2026 looks promising and could be a year of solid economic performance. In our baseline scenario, we expect most of the supportive factors at work in 2025 to continue to play a role in 2026.

Crypto market outlook for 2026

Year 2025 was volatile, as crypto often is.  Among positive catalysts were favourable regulatory changes in the U.S., rise of Digital Asset Treasuries (DAT), adoption of AI and tokenization of Real-World-Assets (RWA).