|

GBP/USD Price Analysis: Bears eye 1.3535 support confluence

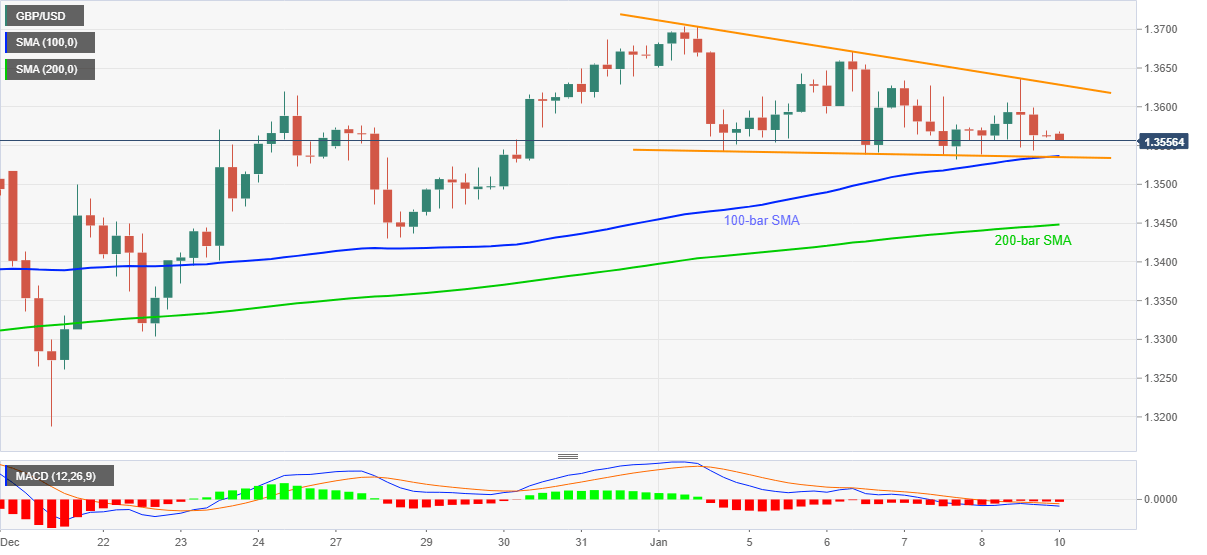
  • GBP/USD remains depressed around mid-1.3500s inside short-term descending triangle.
  • Bearish MACD, virus woes in the UK keep sellers hopeful.
  • 100-bar SMA, triangle’s support restrict immediate downside, buyers seek confirmation of bullish chart for fresh entries.

GBP/USD wavers around 1.3560, after declining for three consecutive days, during the early Asian session on Monday. In doing so, the cable remains inside a short-term falling triangle, a bullish chart pattern, while eyeing to re-test the formation’s support line and 100-bar SMA.

Considering the recent chatters around the coronavirus (COVID-19) woes in the UK, as well as the spread of the virus initially found in Britain, GBP/USD sellers eye further losses while following the bearish MACD.

Read: Japan says it found new coronavirus variant similar to UK strain – Bloomberg

However, a confluence of 100-bar SMA and the support line of a short-term triangle, around 1.3535, will offer a tough challenge to the GBP/USD sellers.

In a case where the sterling declines below 1.3535, the 1.3500 and the 200-bar SMA around 1.3450 will be the key to watch.

Meanwhile, the 1.3600 threshold can entertain short-term buyers before pushing them towards confirming the bullish chart pattern by an upside break of 1.3630.

Following that, GBP/USD bulls can aim for the recently flashed multi-month high near 1.3700 before eyeing the March 2018 low near 1.3715.

Also read: UK Chancellor Sunak looking to delay tax rises and end the stamp duty holiday – Times

GBP/USD four-hour chart

Trend: Further weakness expected

Additional important levels

Overview
Today last price
1.3565
Today Daily Change
2 pips
Today Daily Change %
0.01%
Today daily open
1.3563
 
Trends
Daily SMA20
1.3528
Daily SMA50
1.3368
Daily SMA100
1.3183
Daily SMA200
1.2883
 
Levels
Previous Daily High
1.3636
Previous Daily Low
1.3539
Previous Weekly High
1.3704
Previous Weekly Low
1.3532
Previous Monthly High
1.3686
Previous Monthly Low
1.3134
Daily Fibonacci 38.2%
1.3576
Daily Fibonacci 61.8%
1.3599
Daily Pivot Point S1
1.3522
Daily Pivot Point S2
1.3482
Daily Pivot Point S3
1.3425
Daily Pivot Point R1
1.362
Daily Pivot Point R2
1.3676
Daily Pivot Point R3
1.3717

Author

Anil Panchal

Anil Panchal

FXStreet

Anil Panchal has nearly 15 years of experience in tracking financial markets. With a keen interest in macroeconomics, Anil aptly tracks global news/updates and stays well-informed about the global financial moves and their implications.

More from Anil Panchal
Share:

Editor's Picks

EUR/USD stays offered, sinks below 1.1700

EUR/USD leaves behind two daily advances in a row, facing renewed selling pressure and returning to the sub-1.1700 region in response to the late rebound in the US Dollar ahead of the opening bell in Asia. On Thursday, market participants are expected to closely follow the US weekly report on the labour market, GDP prints and the PCE data.

GBP/USD remains confined in a range above 1.3400 as traders eye US PCE and GDP data

The GBP/USD pair extends its sideways consolidative price move for the second straight day on Thursday and oscillates in a range above the 1.3400 mark during the Asian session. Moreover, a mixed fundamental backdrop warrants some caution before placing directional bets as traders keenly await the crucial US macro data.

Gold slumps below $4,800 as Trump backs off European tariff threat

Gold price trimmed gains to near $4,790 during the early Asian session on Thursday. The precious metal retreats from a record high of $4,888 after US President Donald Trump backs off the European tariff threat and announces a framework Greenland deal.  

AUD/USD rises as employment data boosts RBA outlook

The Australian Dollar advances against the US Dollar on Thursday, following the seasonally adjusted employment data from Australia, which strengthens expectations of tighter monetary policy from the Reserve Bank of Australia.

TACO Wednesday and the great market exhale

Markets did not so much trade on Wednesday as they collectively unclenched. After a bruising bout of headline-induced indigestion, every major asset class caught a bid at once. Stocks up. Bonds up. Gold up, then cooling. Crypto rebounding. Crude firming. Even the dollar found its feet.

Monero risks extending correction as market structure weakens

Monero (XMR) is extending its downtrend, below the $500 level at the time of writing on Wednesday, as sellers remain dominant during the American session. XMR has declined by approximately 38% from a recent high of $800, reached last Wednesday.