|

GBP/USD Price Analysis: Bearish harami confirmed as Pound slumps below 1.2700

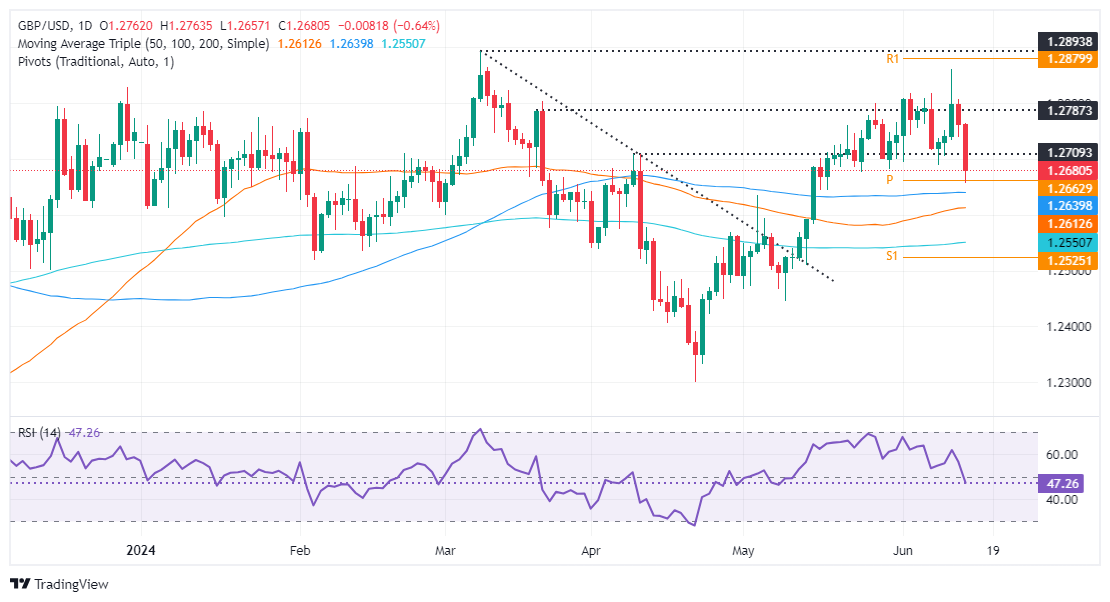
  • GBP/USD drops to 1.2683, marking a new four-week low of 1.2656 amidst risk aversion.
  • Technical outlook: Bearish momentum as RSI falls below 50; potential support at 1.2643/38, 50-DMA at 1.2611, and 200-DMA at 1.2547.
  • Resistance at 1.2700; if breached, expect consolidation in the range of 1.2700-1.2750.

The Pound Sterling dropped sharply below the 1.2700 figure as risk aversion took its toll on most G7 currencies, except for safe-haven peers like the Greenback. Political turmoil in Europe sent the Euro collapsing against the Swiss Franc, while the GBP/USD falls 0.62% and traded at 1.2683 at the time of writing.

GBP/USD Price Analysis: Technical outlook

From a technical standpoint, the GBP/USD has shifted neutral to downward biased, with momentum hinting that sellers are gathering traction. The Relative Strength Index (RSI) has fallen below 50, turning bearish, while price action shows the pair printed a new four-week low of 1.2656, opening the door for additional losses.

If GBP/USD pierces the confluence of the 100-day moving average (DMA) and May 3 swing high turned support at around 1.2643/38, that would accelerate the downtrend, exposing the 50-DMA at 1.2611, ahead of 1.2600. Further losses are seen below the figure, with the 200-DMA at 1.2547 up next.

Conversely, if buyers moved in and reclaim 1.2700, the GBP/USD could consolidate at around 1.2700-1.2750, as stir resistance lies ahead.

GBP/USD Price Action – Daily Chart

GBP/USD

Overview
Today last price1.2683
Today Daily Change-0.0079
Today Daily Change %-0.62
Today daily open1.2762
 
Trends
Daily SMA201.2744
Daily SMA501.2612
Daily SMA1001.264
Daily SMA2001.255
 
Levels
Previous Daily High1.2808
Previous Daily Low1.2738
Previous Weekly High1.2818
Previous Weekly Low1.2695
Previous Monthly High1.2801
Previous Monthly Low1.2446
Daily Fibonacci 38.2%1.2765
Daily Fibonacci 61.8%1.2781
Daily Pivot Point S11.2731
Daily Pivot Point S21.27
Daily Pivot Point S31.2662
Daily Pivot Point R11.2801
Daily Pivot Point R21.2839
Daily Pivot Point R31.287

Author

Christian Borjon Valencia

Markets analyst, news editor, and trading instructor with over 14 years of experience across FX, commodities, US equity indices, and global macro markets.

More from Christian Borjon Valencia
Share:

Editor's Picks

AUD/USD eyes 0.7150 barrier nine-day EMA

AUD/USD inches higher after registering modest losses in the previous day, trading around 0.7130 during the Asian hours. The technical analysis of the daily chart indicates that the pair is moving sideways within the rectangle pattern, suggesting a consolidation as neither the bulls nor the bears have enough momentum to take control of the market.

USD/JPY trades below 160.00 intervention threshold; bullish bias intact

The USD/JPY pair attracts some sellers during the Asian session amid fears that authorities will step in again to prop up the Japanese Yen. Furthermore, the Israel-Lebanon truce prompts some profit-taking around the US Dollar and exerts downward pressure on the currency pair.

Gold extends rebound to $4,500 as US yields edge lower

Gold (XAU/USD) preserves its recovery momentum following Wednesday's slide and tests the $4,500 mark in the second half of the day on Thursday. While US-Iran uncertainty remains, easing tensions between Lebanon on Israel seems to be helping the market mood improve, causing the USD to lose strength alongside falling US T-bond yields and opening the door for a decisive rebound in XAU/USD.

Bitcoin’s massive storm is back: Why the sell-off is far from over

Bitcoin price action over the last few weeks has felt less like a normal, healthy correction and more like a slow grinding crash that continues to wreak havoc on holdings and trading accounts. And everything suggests that the dramatic crash isn’t over.

Nonfarm payrolls: Testing the limits of Fed policy patience

The upcoming nonfarm payrolls report for May will provide the final update on the US labor market before Kevin Warsh attends his first policy meeting as the new Fed Chair later this month.

Recession on paper: What really moves the Canadian Loonie now?

Statistics Canada handed the headline writers a gift and the analysts a headache. Real GDP shrank 0.1% on an annualized basis in the first quarter, and with the fourth quarter of 2025 revised down to a 1.0% contraction, that is two negative quarters in a row, the textbook definition of a technical recession and Canada's first since the pandemic.