|

GBP/USD Price Analysis: Ascending triangle breakdown on 4H targets 1.2158

  • GBP/USD hovers near two-year lows on risk-off trading, UK growth woes.
  • Cable confirmed an ascending triangle breakdown on the 4H chart on Wednesday.
  • Bears gear up for the additional downside towards the pattern target of 1.2158.

GBP/USD is trading back below 1.2200 following a temporary pullback to near the 1.2230 region, as disappointing UK GDP data continues to power GBP bears.

The UK economy contracted 0.1% in March while expanding merely 0.8% QoQ in the first quarter of 2022, backing the BOE’s forecasts of a likely recession later this year.

The downbeat UK growth data combined with the risk-off market profile keeps the downside pressure intact on cable.

Investors shrugged off the upbeat comments from the BOE Deputy Governor Dave Ramsden, as he said that “the central bank isn’t talking down the economy in forecasts.”

Also read: UK Preliminary GDP expands 0.8% QoQ in Q1 vs. 1.0% expected

Looking at cable’s four-hour chart, Wednesday’s confirmation of the ascending triangle breakdown, below the 1.2310 rising trendline support, has opened floors for a test of the pattern target measured at 1.2158.

The Relative Strength Index (RSI) is probing the oversold territory around 30.00, allowing room for more downside.

Should the abovementioned key support give way, a test of the 1.2100 round figure will be inevitable.

GBP/USD: Four-hour chart

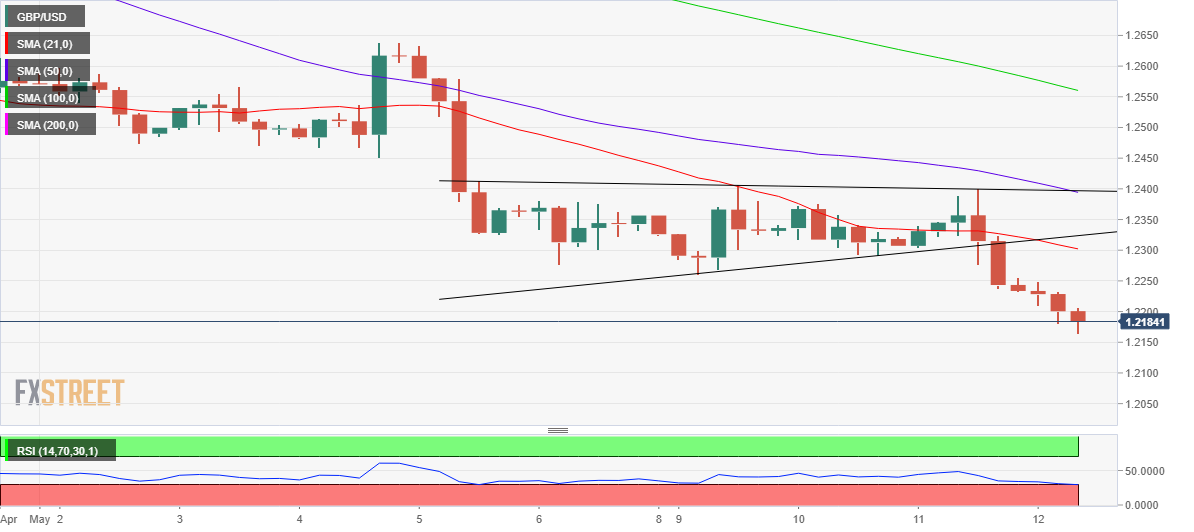
On the other side, any recovery attempts will need acceptance above daily highs of 1.2255.

The next upside target is seen at the bearish 21-Simple Moving Average (SMA) at 1.2302, above which the triangle support (now resistance) at 1.2323 will come into play.

GBP/USD: Additional technical levels

GBP/USD

Overview
Today last price1.2180
Today Daily Change-0.0075
Today Daily Change %-0.61
Today daily open1.2255
 
Trends
Daily SMA201.2661
Daily SMA501.2938
Daily SMA1001.3233
Daily SMA2001.3413
 
Levels
Previous Daily High1.24
Previous Daily Low1.2238
Previous Weekly High1.2638
Previous Weekly Low1.2276
Previous Monthly High1.3167
Previous Monthly Low1.2411
Daily Fibonacci 38.2%1.23
Daily Fibonacci 61.8%1.2338
Daily Pivot Point S11.2195
Daily Pivot Point S21.2135
Daily Pivot Point S31.2032
Daily Pivot Point R11.2358
Daily Pivot Point R21.246
Daily Pivot Point R31.252

Author

Dhwani Mehta

Dhwani Mehta

FXStreet

Residing in Mumbai (India), Dhwani is a Senior Analyst and Manager of the Asian session at FXStreet. She has over 10 years of experience in analyzing and covering the global financial markets, with specialization in Forex and commodities markets.

More from Dhwani Mehta
Share:

Editor's Picks

AUD/USD falls to near 0.7100 after slipping below 50-day EMA

AUD/USD depreciates after registering minor gains in the previous day, trading around 0.7120 during the Asian hours. The technical analysis of the daily chart shows the pair consolidating sideways within a rectangle pattern, as neither bulls nor bears gain control. The AUD/USD pair is holding a slight bearish tone however as it sits beneath both the nine-day and 50-day EMAs.

160.00: USD/JPY back near intervention territory after upbeat US jobs report

US Nonfarm Payrolls beat expectations by a wide margin in May, with 172K jobs added. The US Dollar rebounds after the release, helping USD/JPY recover from its intraday lows. Warnings from Japanese authorities continue to limit upside potential near the 160.00 threshold.

Gold targets $4,300 amid stronger Dollar

Gold faces increasing selling interest and navigates the area of three-month lows near the $4,300 mark per troy ounce on Friday. The precious metal’s decline comes as traders assess the stronger-than-expected NFP, while the bid bias in the Greenback and higher US Treasury yields also collaborate with the retracement.

Cardano hits five-year low even as Hoskinson clarifies "break" isn't an exit

Cardano (ADA) price is down 10% at press time on Friday, extending losses over 30% so far this week amid Charles Hoskinson's clarification that "break" isn't an exit.

Week ahead – Fed countdown begins amid US inflation data and geopolitical risks

Fed Chair Warsh’s first meeting approaches as key US inflation data could reshape expectations. Oil prices remain elevated as US-Iran talks continue; tariffs also return to the spotlight. ECB is expected to hike; will it be a one-off move or is July live?

The US economy defies the rules: 100 days into the Oil shock and the recession signal is still missing

More than three months after the start of the Iran war and the resulting disruption to global energy markets, the US economy continues to display remarkable resilience. The conflict has triggered a sharp rise in Oil prices, reignited inflationary pressures and fueled widespread concerns about a potential economic slowdown.