|

GBP/USD Price Analysis: 21DMA guards the downside at the start of the week

  • GBP/USD rises for the first time in three straight days on Monday.
  • Broad US Dollar weakness underpins Cable despite Fed-BoE policy divergence.
  • Pound Sterling bulls stay hopeful while above 21DMA, looks to 1.2200.

GBP/USD is consolidating the rebound below the 1.2200 threshold, as bulls trade with caution amid a downbeat market mood at the start of the week on Monday.

Broad-based US Dollar weakness is underpinning the uptick in the Pound Sterling, despite the continued widening policy divergence between the US Federal Reserve (Fed) and the Bank of England (BoE). The slide in the USD/JPY pair is exerting bearish pressure on the US Dollar, as investors pay little heed to the higher Treasury bond yields.

From a short-term technical perspective, the bullish 21-Daily Moving Average (DMA) at 1.2146 continues to offer support to GBP bulls, despite the rising wedge breakdown confirmed last week.

The upside appears more compelling for Cable, as the 14-day Relative Strength Index (RSI) inches higher above the midline.

Meanwhile, the double Bull Cross confirmation, with the 21DMA cutting the 200DMA from below and the 50DMA piercing the 100DMA for the upside, also adds credence to the rebound.

On the upside, GBP buyers need to recapture the 1.2200 barrier to extend the recovery toward Friday’s high at 1.2223, above which a fresh advance toward the wedge support-turned-resistance at 1.2424 will be on the cards. The six-month high at 1.2446 will be next on buyers’ radars.

GBP/USD: Daily chart

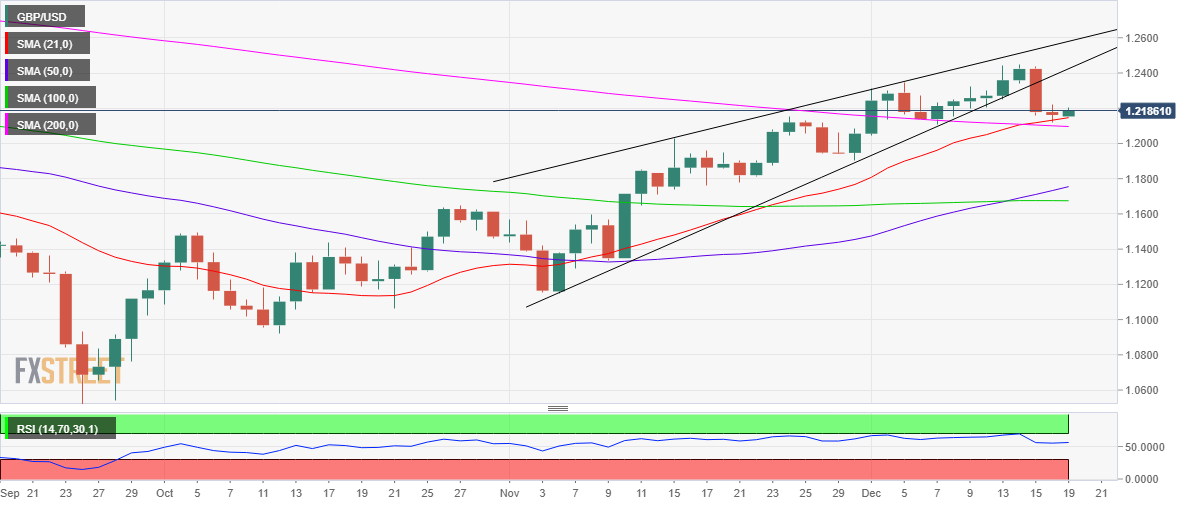
On the flip side, failure to defend the 21DMA on a daily closing basis will put the descending 200DMA at 1.2096 under threat.

A sustained break below the latter will initiate a fresh downswing toward the bullish 50DMA at 1.1755.

GBP/USD: Additional technical levels

GBP/USD

Overview
Today last price1.2182
Today Daily Change0.0020
Today Daily Change %0.16
Today daily open1.2162
 
Trends
Daily SMA201.2144
Daily SMA501.1732
Daily SMA1001.1675
Daily SMA2001.21
 
Levels
Previous Daily High1.2223
Previous Daily Low1.212
Previous Weekly High1.2447
Previous Weekly Low1.212
Previous Monthly High1.2154
Previous Monthly Low1.1147
Daily Fibonacci 38.2%1.2159
Daily Fibonacci 61.8%1.2184
Daily Pivot Point S11.2113
Daily Pivot Point S21.2065
Daily Pivot Point S31.201
Daily Pivot Point R11.2217
Daily Pivot Point R21.2272
Daily Pivot Point R31.232

Author

Dhwani Mehta

Dhwani Mehta

FXStreet

Residing in Mumbai (India), Dhwani is a Senior Analyst and Manager of the Asian session at FXStreet. She has over 10 years of experience in analyzing and covering the global financial markets, with specialization in Forex and commodities markets.

More from Dhwani Mehta
Share:

Editor's Picks

EUR/USD remains heavy near 1.1600 after hot EU inflation data

EUR/USD remains heavily offered near 1.1600, six-week lows, in the European session on Tuesday. The pair fails to find any inspiration from a surprise pick up in Eurozone inflation for February, as the US Dollar continues to attract safe haven flows amid escalating geopolitical tensions in the Middle East. 

GBP/USD attacks 1.3300, refreshing three-month lows

GBP/USD is deep in the red near 1.3300, accelerating its downside to renew three-month lows in European trading on Tuesday. The ongoing escalation in the Iran war, combined with rising Oil prices, weighs negatively on the higher-yielding Pound Sterling as the US Dollar capitalizes on increased haven demand.

Gold falls below $5,300 as stronger USD counter Middle East woes

Gold attracts some intraday selling and falls below $5,300 on Tuesday. The US Dollar climbs to a fresh high since January 20 and turns out to be a key factor exerting downward pressure on the commodity. However, concerns about a broader regional conflict in the Middle East continue to weigh on investors' sentiment and underpin demand for the traditional safe-haven bullion.

Stellar risks deeper losses as derivatives metrics turn negative

Stellar is trading red below $0.16 at the time of writing on Tuesday, after a slight recovery the previous day. Weakening derivatives data caps the recovery, while an unfavorable technical outlook projects a deeper correction for the XLM token in the upcoming days.

Middle East conflict ramps up a gear as energy price spike rips through markets

It’s another risk off day as geopolitical headwinds continue to batter financial markets. Although markets calmed during the US session and US stocks managed to post gains on Monday, this has not fed through to the European session, and stocks and bonds are sharply lower for a second day.

Hyperliquid Price Forecast: HYPE rises on commodities demand amid US-Iran war

Hyperliquid (HYPE) steadies above $33 at press time on Tuesday, marking its fourth consecutive day of recovery in a broadly volatile market due to the ongoing US-Israel strikes on Iran.