GBP/USD Price Analysis: 1.2400 cushion looks fragile amid geopolitical tensions
- GBP/USD is struggling in expecting its recovery above 1.2430 amid China-Taiwan tensions.
- The US Dollar Index (DXY) is putting efforts into defending its crucial support of 102.00 after a marginal correction.
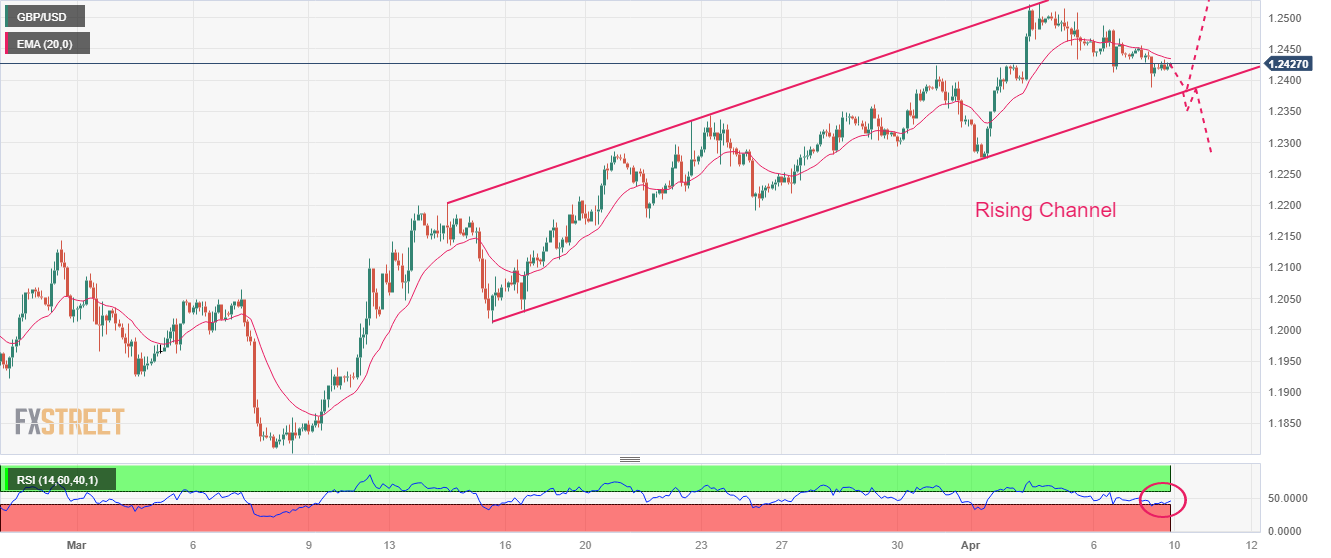
- GBP/USD is expected to extend its correction to near the lower portion of the Rising Channel chart pattern.

The GBP/USD pair is hovering below 1.2430 after a recovery move from the round-level support of 1.2400 in the early Asian session. Expectations for a corrective move in the Cable look healthy as China-Taiwan tensions are deepening further. On late Sunday, the Taiwan Defence Ministry reported that they spotted 58 Chinese aircrafts, which also includes nine ships. Meanwhile, State Media reported that the Chinese military told about keeping the momentum of drilling around Taiwan Island.
The US Dollar Index (DXY) is putting efforts into defending its crucial support of 102.00 after a marginal correction. It is likely that geopolitical tensions would provide some support to the USD Index. The USD Index is likely to remain in action ahead of the release of the United States Consumer Price Index (CPI) data, which will release on Wednesday. Headline inflation is expected to soften further as oil prices remained weak in March, however, core inflation might accelerate as anticipated.
S&P500 futures are showing some gains in the early Asian session, indicating some strength in equities ahead of earnings season.
On a two-hour scale, GBP/USD is expected to extend its correction to near the lower portion of the Rising Channel chart pattern. The 20-period Exponential Moving Average (EMA) at 1.2436 is restricting upside attempts from the Pound Sterling.
Meanwhile, the Relative Strength Index (RSI) (14) is defending its downside around 40.00. A break below the same would trigger the bearish momentum.
For a downside move, the Cable needs to deliver a breakdown of the Rising Channel pattern below March 23 high at 1.2343, which will expose the asset to the round-level support of 1.2300 followed by March 14 high around 1.2200.
Alternatively, a decisive move above Friday’s high at 1.2453 will drive the asset towards April 04 high at 1.2525. A break above the latter would further drive the Cable toward the round-level resistance at 1.2600.
GBP/USD two-hour chart
Author

Sagar Dua
FXStreet
Sagar Dua is associated with the financial markets from his college days. Along with pursuing post-graduation in Commerce in 2014, he started his markets training with chart analysis.