|

GBP/USD has significant support only at 1.29— Confluence Detector

GBP/USD has been retreating amid dovish comments from various members of the Bank of England. How far can it fall? 

The Technical Confluences Indicator is showing that pound/dollar has some support 1.3009, which is the meeting point of the Pivot Point one-day Support 2 and the Bollinger Band 4h-Lower. 

Sterling has another cushion at 1.2982, where two pivot points converge: the one-week Support 1 and the one-day Support 3. 

Significant support is only at 1.29, which is the confluence between the PP one-week S2 and the previous month's low. 

Looking up, resistance is significant. It includes 1.3063, which is the convergence of the Simple Moving Average 10-4h, the Fibonacci 23.6% one-week, and the SMA 200-15m. 

Stronger support is at 1.3096, which is a juncture of lines including the BB-one-day-Middle, the SMA 100-1h, the SMA 200-4h, and the SMA 5-one-day.

The most significant cap is at 1.3137, where the SMA 200-1h, the Fibonacci 161.8% one-day, the Fibonacci 61.8% one-month, and the Fibonacci 61.8% one-week.

All in all, the path of least resistance is to the downside. 

This is how it looks on the tool:
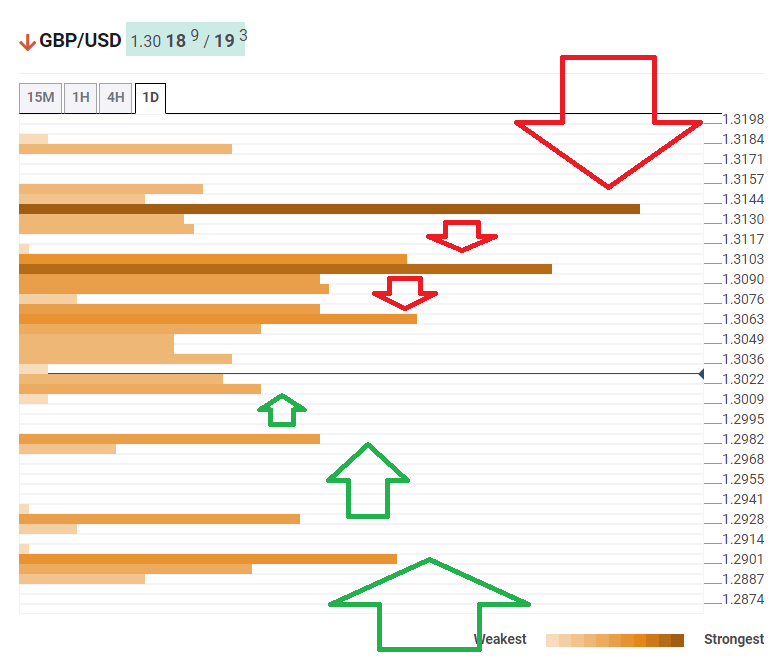
GBP USD technical confluence January 13 2020
 

Confluence Detector

The Confluence Detector finds exciting opportunities using Technical Confluences. The TC is a tool to locate and point out those price levels where there is a congestion of indicators, moving averages, Fibonacci levels, Pivot Points, etc. Knowing where these congestion points are located is very useful for the trader, and can be used as a basis for different strategies.

This tool assigns a certain amount of “weight” to each indicator, and this “weight” can influence adjacents price levels. This means that one price level without any indicator or moving average but under the influence of two “strongly weighted” levels accumulate more resistance than their neighbors. In these cases, the tool signals resistance in apparently empty areas.

Learn more about Technical Confluence

Author

Yohay Elam

Yohay Elam

FXStreet

Yohay is in Forex since 2008 when he founded Forex Crunch, a blog crafted in his free time that turned into a fully-fledged currency website later sold to Finixio.


More from Yohay Elam
Share:

Editor's Picks

AUD/USD defends 0.7000 ahead of RBA on Tuesday

AUD/USD is defending 0.7000 at the start of a new week, trading near its lowest level since August 4 amid a bullish US Dollar. US yields hold near multi-year highs amid inflation risks from higher oil prices and rising bets on an October Fed rate hike. This, along with the US-Iran standoff, continues to underpin the safe-haven buck and weigh on the pair ahead of Tuesday's RBA policy announcements.

USD/JPY climbs back toward 158.00 after BoJ minutes amid firm USD

USD/JPY finds dip-buyers and reverses part of Friday's slide driven by speculation that authorities will step in again to prop up the Japanese Yen. However, the BoJ's dovish Minutes cap the JPY. Meanwhile, the US Dollar regains traction as the US-Iran standoff supports crude oil prices, fueling inflation fears and reaffirming bets for an October Fed rate hike. This further supports the pair, driving it back toward 158.00.

Gold tumbles further; focus shifts to $4,100

Gold kicks in the week on the back foot, selling off to the vicinity of the $4,100 mark per troy ounce, levels last traded back in early August. The resurgence of geopolitical concerns in combination with the firmer US Dollar and rising US Treasury yields keep the yellow metal under heavy pressure on Monday.

Bitcoin dips as ETF inflows meet Fed headwinds

Bitcoin trades below $82,800 at the time of writing on Monday after gaining over 4% last week, with the rally losing momentum near recent highs. Strong institutional demand, supported by spot Bitcoin Exchange Traded Fund inflows, continues to drive demand.

The week ahead: A key moment for the global economy as threats rise

UK diesel hits a record, as economic concerns rise. The market expects an aggressive Fed rate hiking cycle, but is it necessary? Oil supply concerns ease, even as oil prices rise. What’s next for the AI trade.

Fed vs BoJ: Both hiked. The market only believes one of them – and the chart shows which

The Fed and the BoJ have just done something remarkably similar. Both central banks raised interest rates by 25 bps last week, both are confronting inflation risks, and both signal that future decisions will depend on incoming economic data.














