GBP/JPY Price Forecasts: Bulls might find resistance at the 209.65 area
- GBP/JPY trims previous losses and returns above 209.00.
- The broader trend remains bearish, with the Yen on track to its best performance in ten months.
- Pound bulls are likely to be challenged at 209.65.

The Pound (GBP) is trimming losses against the Japanese Yen (JPY) on Friday, with the pair returning above 209.00 after bouncing at nearly two-week lows at 207.60. The broader trend, however, remains bearish, following a nearly 3% decline in the previous four days, and the resistance area at 209.65 is likely to challenge bulls.
The Yen corrects lower on Friday, but remains the strongest performer among the G8 currencies this week. The Japanese currency surged following the historic victory of Prime Minister Sanae Takaichi in last weekend’s elections, while the Pound struggled amid the weak UK Gross Domestic Product figures released on Thursday.
Technical Analysis
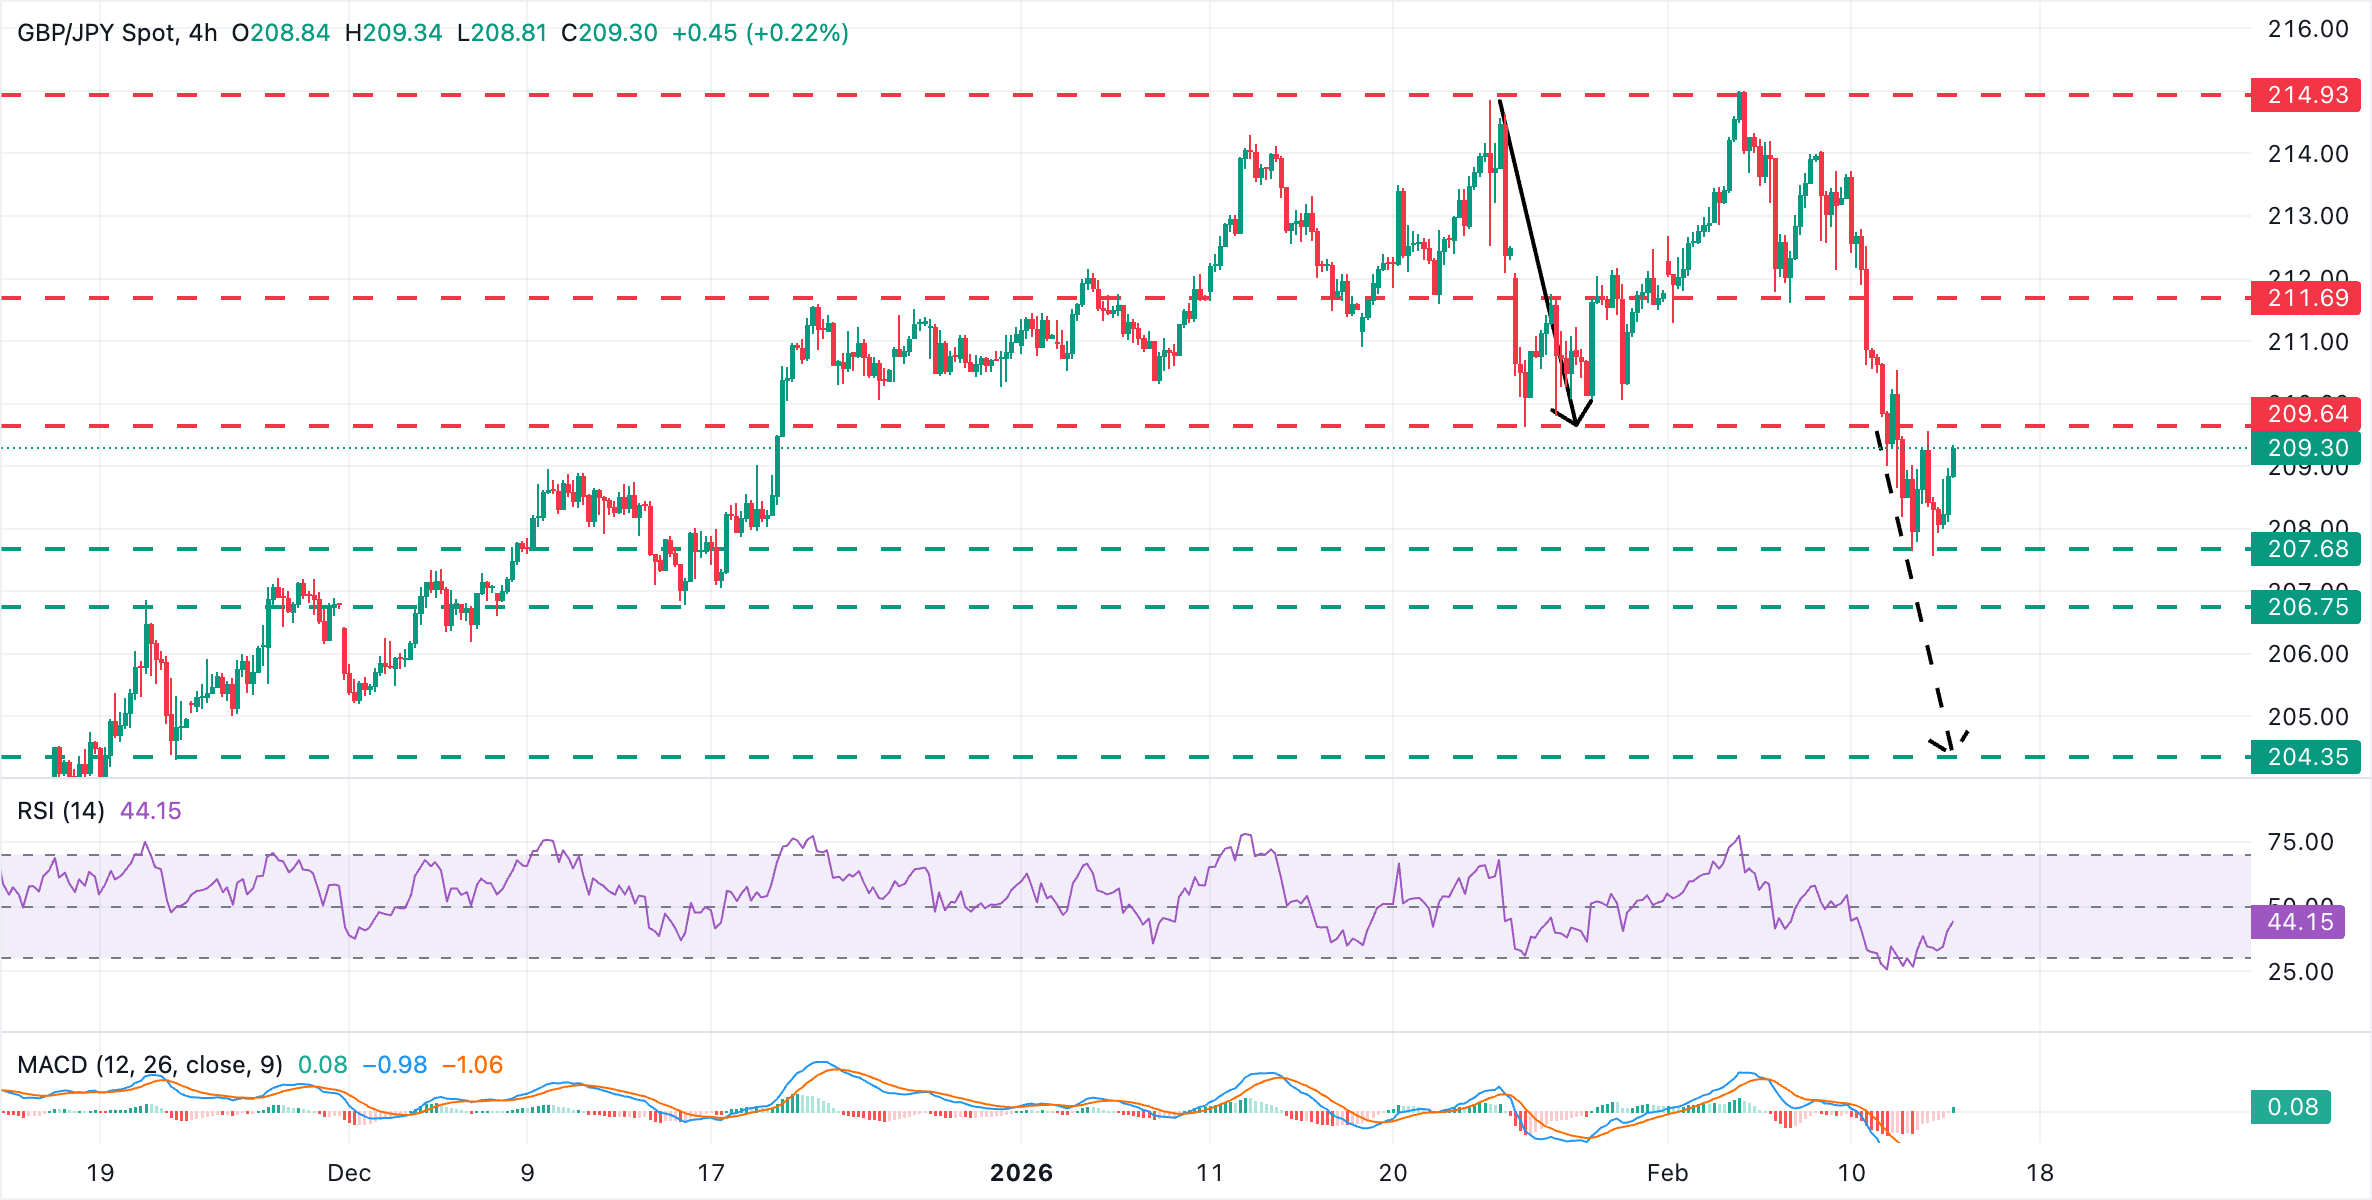
The 4-hour chart shows the GBP/JPY bouncing up amid an easing bearish momentum. The Moving Average Convergence Divergence (MACD) has flipped into positive territory, and the Relative Strength Index (RSI) sits at 43.53, below the 50 midline, suggesting recovering but still subdued momentum.
Bulls are likely to meet important resistance at the 209.65 area, which is the neckline of the January 23, February 4 Double Top, right below 215.00. Further up, the next target is the February 6 low, near 211.60. Supports are at Thursday's low of 207.57 and the mid-December lows near 206.80. The Double Top's measured target is the November 21 low, at 204.30.
(The technical analysis of this story was written with the help of an AI tool.)
Japanese Yen Price This week
The table below shows the percentage change of Japanese Yen (JPY) against listed major currencies this week. Japanese Yen was the strongest against the US Dollar.
| USD | EUR | GBP | JPY | CAD | AUD | NZD | CHF | |
|---|---|---|---|---|---|---|---|---|
| USD | -0.41% | -0.24% | -2.52% | -0.51% | -0.95% | -0.43% | -0.98% | |
| EUR | 0.41% | 0.18% | -2.19% | -0.11% | -0.54% | -0.03% | -0.58% | |
| GBP | 0.24% | -0.18% | -2.05% | -0.28% | -0.72% | -0.20% | -0.75% | |
| JPY | 2.52% | 2.19% | 2.05% | 2.12% | 1.66% | 2.21% | 1.52% | |
| CAD | 0.51% | 0.11% | 0.28% | -2.12% | -0.34% | 0.09% | -0.47% | |
| AUD | 0.95% | 0.54% | 0.72% | -1.66% | 0.34% | 0.52% | -0.06% | |
| NZD | 0.43% | 0.03% | 0.20% | -2.21% | -0.09% | -0.52% | -0.55% | |
| CHF | 0.98% | 0.58% | 0.75% | -1.52% | 0.47% | 0.06% | 0.55% |
The heat map shows percentage changes of major currencies against each other. The base currency is picked from the left column, while the quote currency is picked from the top row. For example, if you pick the Japanese Yen from the left column and move along the horizontal line to the US Dollar, the percentage change displayed in the box will represent JPY (base)/USD (quote).
Author

Guillermo Alcala
FXStreet
Graduated in Communication Sciences at the Universidad del Pais Vasco and Universiteit van Amsterdam, Guillermo has been working as financial news editor and copywriter in diverse Forex-related firms, like FXStreet and Kantox.