GBP/USD halts momentum as markets weigh US Retail Sales, UK labor data
- GBP/USD remained trapped in congestion near 1.3400 on Thursday.
- US Retail Sales figures beat expectations, and UK labor numbers softened.
- Cable bullish momentum has run out of gas early, struggling to keep bidders on track.

GBP/USD churned around the 1.3400 region on Thursday, grappling with fresh congestion after a brief reprieve from sustained selling pressure. United Kingdom (UK) labor data broadly missed the mark, and US Retail Sales came in stronger than expected.
The UK added 25.9K new unemployment benefits seekers in June, more than expected but still below the previous month’s 33.1K. The UK Unemployment Rate also ticked higher, rising to 4.7% from the previous 4.6%. On the United States (US) side, Producer Price Index (PPI) inflation cooled off faster than expected, further bolstering market confidence that tariff fallout will have less of an impact on inflation than Federal Reserve (Fed) officials are fearing.
Coming up on Friday, UK data remains free and clear on the data docket, while US markets will still have to grapple with University of Michigan (UoM) Consumer Sentiment Index data for July. The UoM’s aggregated survey results aggregator is expected to continue grind out of a meager recovery, and is forecast to rise to 61.5 from 60.7.
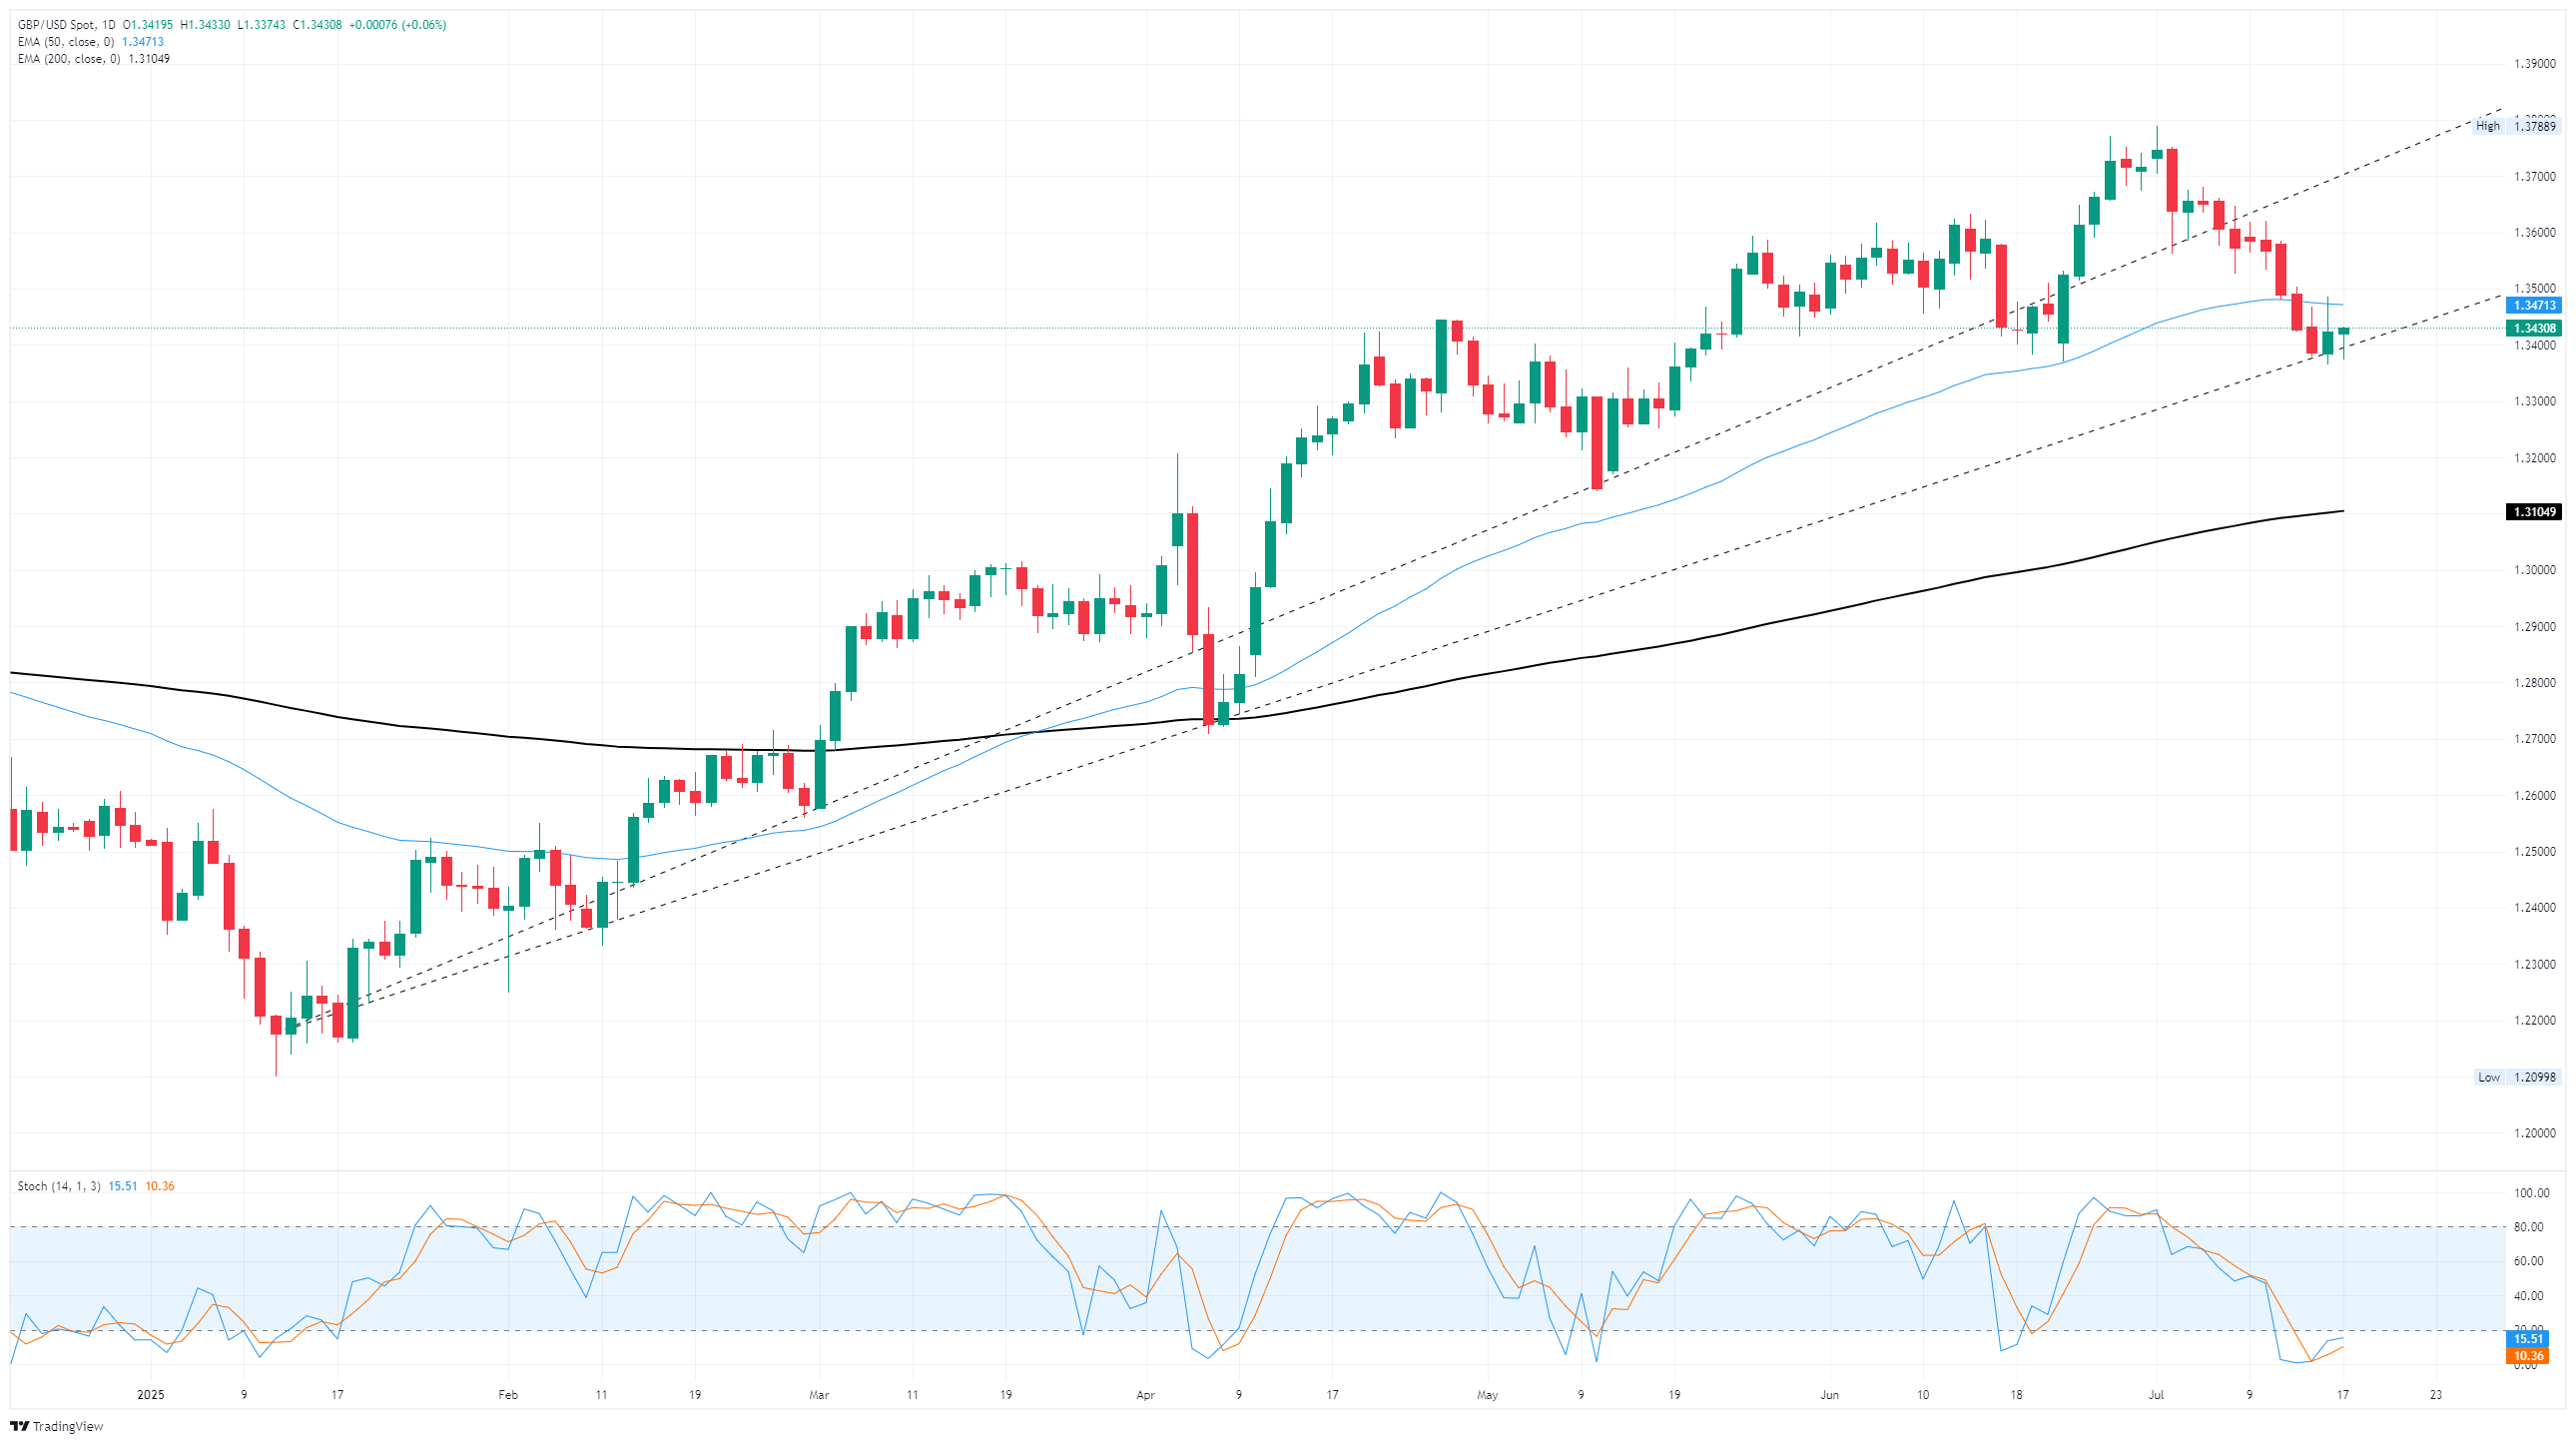
GBP/USD price forecast
Cable’s midweek rebound has cut off a one-sided near-term decline after Cable tumbled away from multi-year highs in early July. GBP/USD looks set to confirm a technical bounce from the 1.3400 handle, but only if bidding pressure is able to maintain momentum.
GBP/USD daily chart
Pound Sterling FAQs
The Pound Sterling (GBP) is the oldest currency in the world (886 AD) and the official currency of the United Kingdom. It is the fourth most traded unit for foreign exchange (FX) in the world, accounting for 12% of all transactions, averaging $630 billion a day, according to 2022 data. Its key trading pairs are GBP/USD, also known as ‘Cable’, which accounts for 11% of FX, GBP/JPY, or the ‘Dragon’ as it is known by traders (3%), and EUR/GBP (2%). The Pound Sterling is issued by the Bank of England (BoE).
The single most important factor influencing the value of the Pound Sterling is monetary policy decided by the Bank of England. The BoE bases its decisions on whether it has achieved its primary goal of “price stability” – a steady inflation rate of around 2%. Its primary tool for achieving this is the adjustment of interest rates. When inflation is too high, the BoE will try to rein it in by raising interest rates, making it more expensive for people and businesses to access credit. This is generally positive for GBP, as higher interest rates make the UK a more attractive place for global investors to park their money. When inflation falls too low it is a sign economic growth is slowing. In this scenario, the BoE will consider lowering interest rates to cheapen credit so businesses will borrow more to invest in growth-generating projects.
Data releases gauge the health of the economy and can impact the value of the Pound Sterling. Indicators such as GDP, Manufacturing and Services PMIs, and employment can all influence the direction of the GBP. A strong economy is good for Sterling. Not only does it attract more foreign investment but it may encourage the BoE to put up interest rates, which will directly strengthen GBP. Otherwise, if economic data is weak, the Pound Sterling is likely to fall.
Another significant data release for the Pound Sterling is the Trade Balance. This indicator measures the difference between what a country earns from its exports and what it spends on imports over a given period. If a country produces highly sought-after exports, its currency will benefit purely from the extra demand created from foreign buyers seeking to purchase these goods. Therefore, a positive net Trade Balance strengthens a currency and vice versa for a negative balance.
Author

Joshua Gibson
FXStreet
Joshua joins the FXStreet team as an Economics and Finance double major from Vancouver Island University with twelve years' experience as an independent trader focusing on technical analysis.


