GBP/USD dips under 200-day SMA as UK data and BoE rate cut odds weigh
- GBP/USD drops 0.35% to 1.3219, slipping under the 200-day SMA at 1.3237 for the first time in weeks.
- UK inflation remained unchanged in September and labor data softens, prompting markets to price in odds of a December BoE rate cut near 74%.
- Fed expected to deliver 25 bps cut Wednesday, though Powell’s tone is uncertain amid prolonged US data blackout.

GBP/USD drops more than 0.35% on Wednesday, below the 1.3250 mark, as the Bank of England (BoE) rate cut expectations for the November meeting rise while traders await the Federal Reserve (Fed) monetary policy decision.
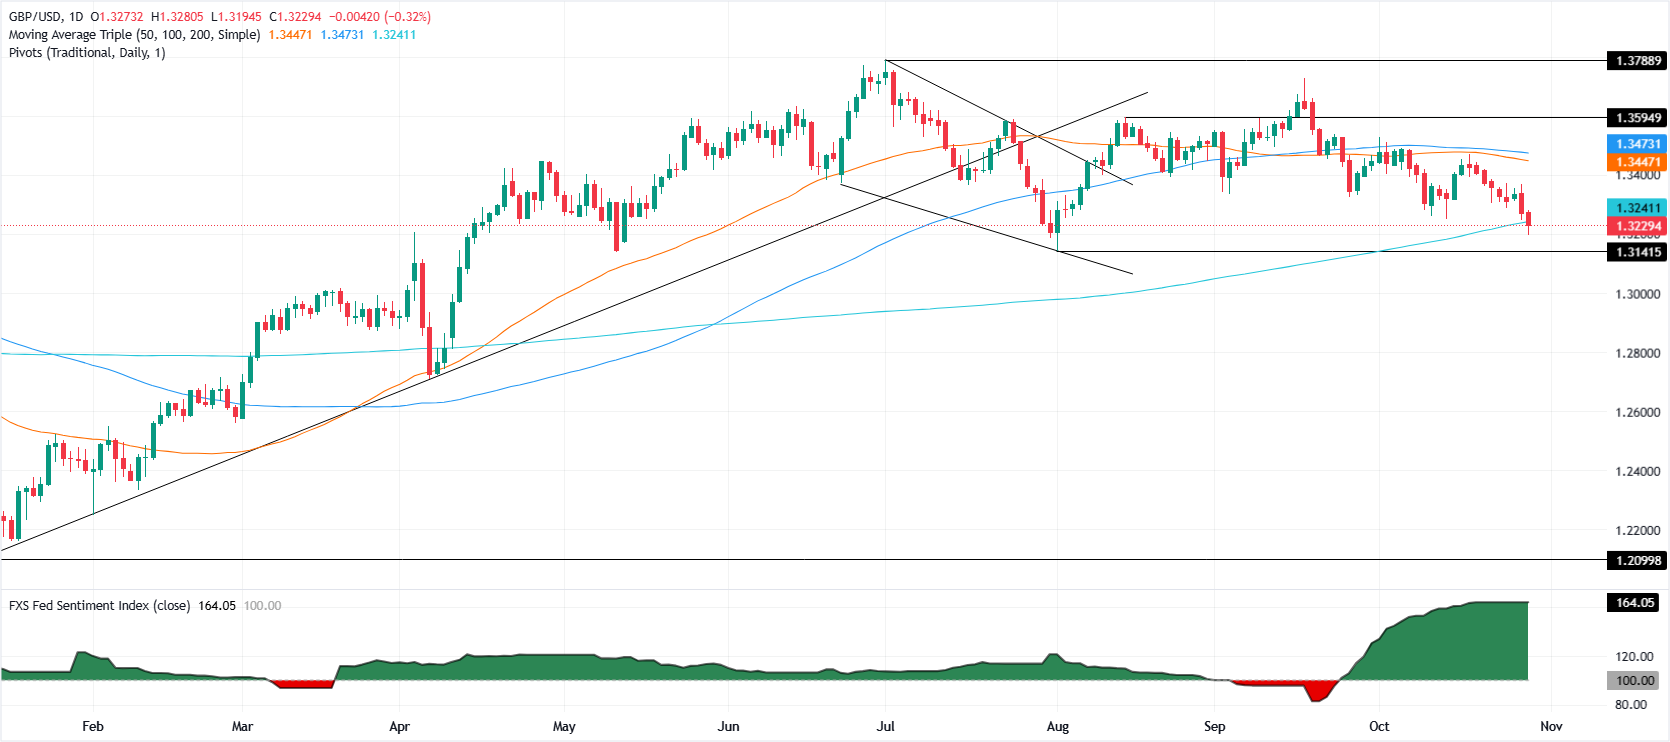
The GBP/USD pair trades at 1.3219 at the time of writing, as sellers pushed the spot price below the 200-day Simple Moving Average (SMA) at 1.3237.
Sterling weakens as soft UK data and fiscal concerns weigh ahead of key central bank meetings
Data in the UK showed signs that the labor market is weakening and inflation remained unchanged at 3.8% in September. Also, an article published by the Financial Times said that Chancellor Rachel Reeves could face a £20 billion hit to public finances following a productivity downgrade by the Office for Budget Responsibility (OBR).
Market participants had priced in a 74% rate cut in December, as revealed by the LSEG central bank interest rate probability tool.
Across the pond, market players had priced in a 25-basis-point rate cut by the Fed later in the day. However, there are growing doubts about the message by the Fed Chair Jerome Powell, as the government shutdown keeps data scarce.
GBP/USD Price Forecast: Technical outlook
The technical picture suggests further downside in GBP/USD. A daily close below the 200-day SMA can pave the way for challenging the August 1 swing low of 1.3141, followed by the 1.3100 mark. On further weakness, the next cycle low is the April 7 low of 1.2707.
Conversely, if GBP/USD claims 1.3300, look for a test of the 20-day SMA at 1.3367, ahead of 1.3400.
(This story was corrected on October 29 at 16:04 GMT to say that inflation in the UK remained unchanged at 3.8% in September, instead of easing.)
Pound Sterling FAQs
The Pound Sterling (GBP) is the oldest currency in the world (886 AD) and the official currency of the United Kingdom. It is the fourth most traded unit for foreign exchange (FX) in the world, accounting for 12% of all transactions, averaging $630 billion a day, according to 2022 data. Its key trading pairs are GBP/USD, also known as ‘Cable’, which accounts for 11% of FX, GBP/JPY, or the ‘Dragon’ as it is known by traders (3%), and EUR/GBP (2%). The Pound Sterling is issued by the Bank of England (BoE).
The single most important factor influencing the value of the Pound Sterling is monetary policy decided by the Bank of England. The BoE bases its decisions on whether it has achieved its primary goal of “price stability” – a steady inflation rate of around 2%. Its primary tool for achieving this is the adjustment of interest rates. When inflation is too high, the BoE will try to rein it in by raising interest rates, making it more expensive for people and businesses to access credit. This is generally positive for GBP, as higher interest rates make the UK a more attractive place for global investors to park their money. When inflation falls too low it is a sign economic growth is slowing. In this scenario, the BoE will consider lowering interest rates to cheapen credit so businesses will borrow more to invest in growth-generating projects.
Data releases gauge the health of the economy and can impact the value of the Pound Sterling. Indicators such as GDP, Manufacturing and Services PMIs, and employment can all influence the direction of the GBP. A strong economy is good for Sterling. Not only does it attract more foreign investment but it may encourage the BoE to put up interest rates, which will directly strengthen GBP. Otherwise, if economic data is weak, the Pound Sterling is likely to fall.
Another significant data release for the Pound Sterling is the Trade Balance. This indicator measures the difference between what a country earns from its exports and what it spends on imports over a given period. If a country produces highly sought-after exports, its currency will benefit purely from the extra demand created from foreign buyers seeking to purchase these goods. Therefore, a positive net Trade Balance strengthens a currency and vice versa for a negative balance.
Author

Christian Borjon Valencia
FXStreet
Markets analyst, news editor, and trading instructor with over 14 years of experience across FX, commodities, US equity indices, and global macro markets.


