GBP/USD bulls attempting to break into stongly bullish territories
- GBP/USD is attempting to move higher into a bullish area on the daily chart.
- The softness in the US dollar at the start of the week is underpinning the upside bias.

At 1.2655, GBP/USD is 0.18% higher having risen from a low of 1.2616 to score a high of 1.2660 so far on the day. It is a holiday-shortened week and Monday's ranges are narrow making for a slow start to the week for G10 FX.
That being said, risk assets remain in demand as investors continue to cheer the gradual easing of the lockdown in China. Additionally, the pricing of a Fed pause allows interest to return to FX carry trades which is weighing on the greenback and enabling the pound to move higher. USD has dipped in reflection of speculation that the Fed may take a pause in its rate hiking cycle in September.
Last week's £15bn fiscal stimulus provided some support to sterling which is lingering at the start of the week also. Equally, the backbone of a strong UK labour and inflation data has switched the focus of the market back to price pressures from growth concerns. The Bank of England meets this month and there is speculation of a more hawkish reaction from the Old Lady. Nevertheless, ''signs of weakness in the UK April Gross Domestic Product data, due in the middle of June, or a softening in consumer sentiment surveys are likely to undermine the pound,'' analysts at Rabobank said.
''Simultaneously, fears about slowing growth in China and energy security risks in Europe could bolster safe-haven demand for the USD. In an environment in which the Fed and other central banks are removing liquidity, we expect higher levels of volatility in FX market. We see risk that GBP/USD could again re-visit its recent lows in the coming months.''
GBP/USD technical analysis

The price is breaking to the upside and moving in on an area of price imbalance for which mitigation thereof leaves the 1.30 figure vulnerable for the foreseeable future so long as 1.2600 holds on any forthcoming retests.
GBP/USD H1 chart
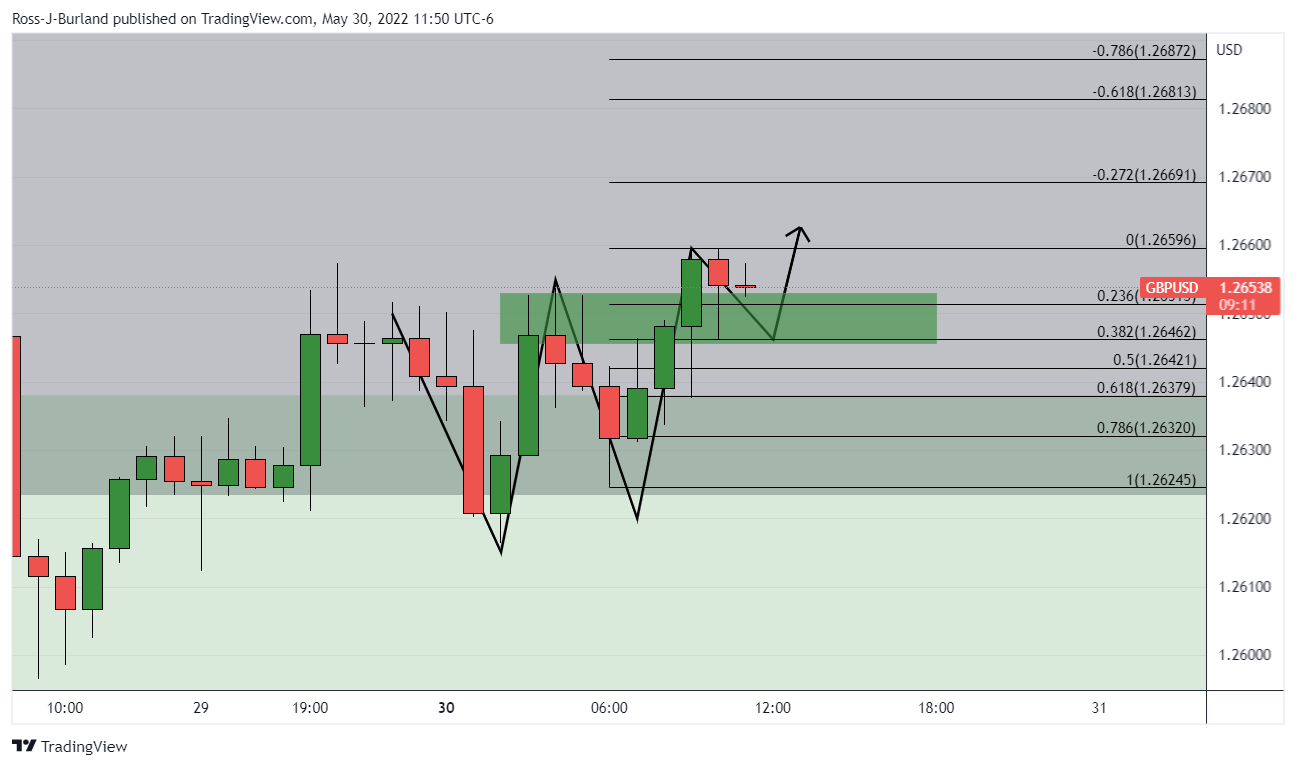
From a 1-hour perspective, the W-formation is a reversion pattern. The price has already retraced to retest the neckline in a 38.2% Fibonacci correction which has mitigated the price imbalance and therefore puts the ball back into the bull's court. However, a more complete correction over the coming candles could be in order but an interruption in a bullish close at the top of this hour would be reinforcing the upside bias.
Author

Ross J Burland
FXStreet
Ross J Burland, born in England, UK, is a sportsman at heart. He played Rugby and Judo for his county, Kent and the South East of England Rugby team.


