|

GBP/JPY Technical Analysis: Sterling volatile as Brexit Vote unfolds
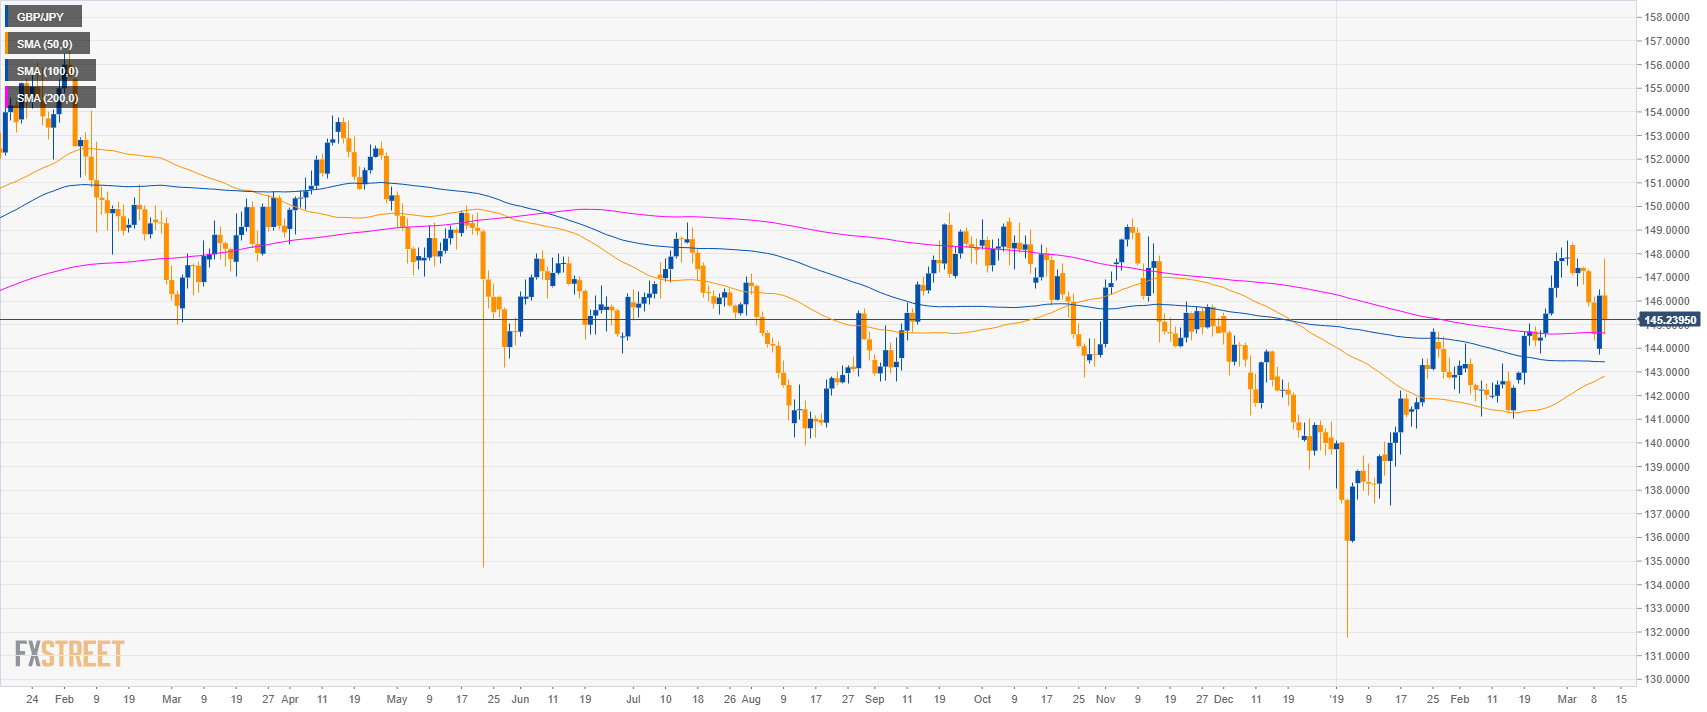
GBP/JPY daily chart

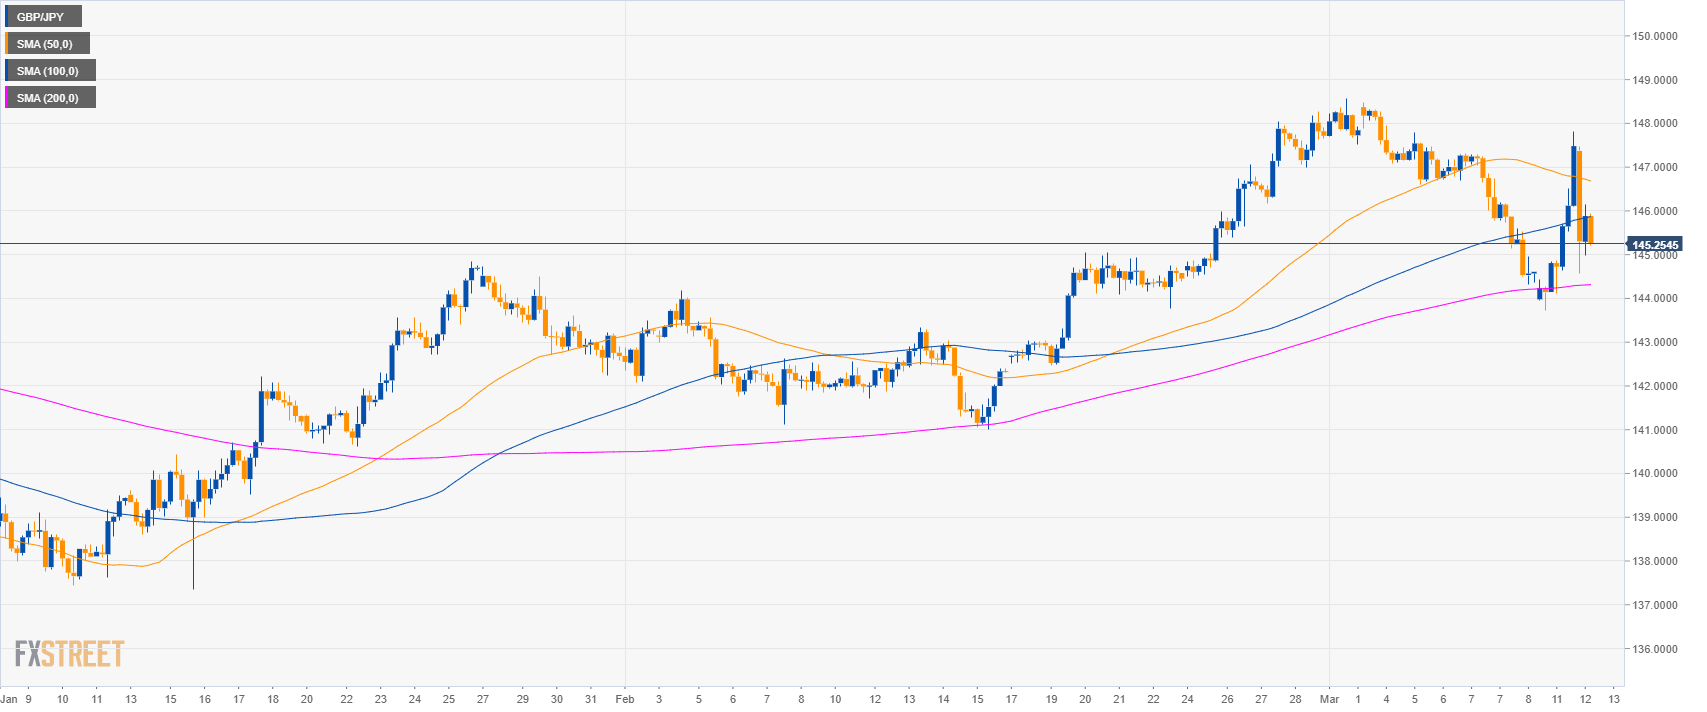
GBP/JPY 4-hour chart

  • GBP/JPY is trading between the 100 and 200 SMAs suggesting consolidation in the medium-term.

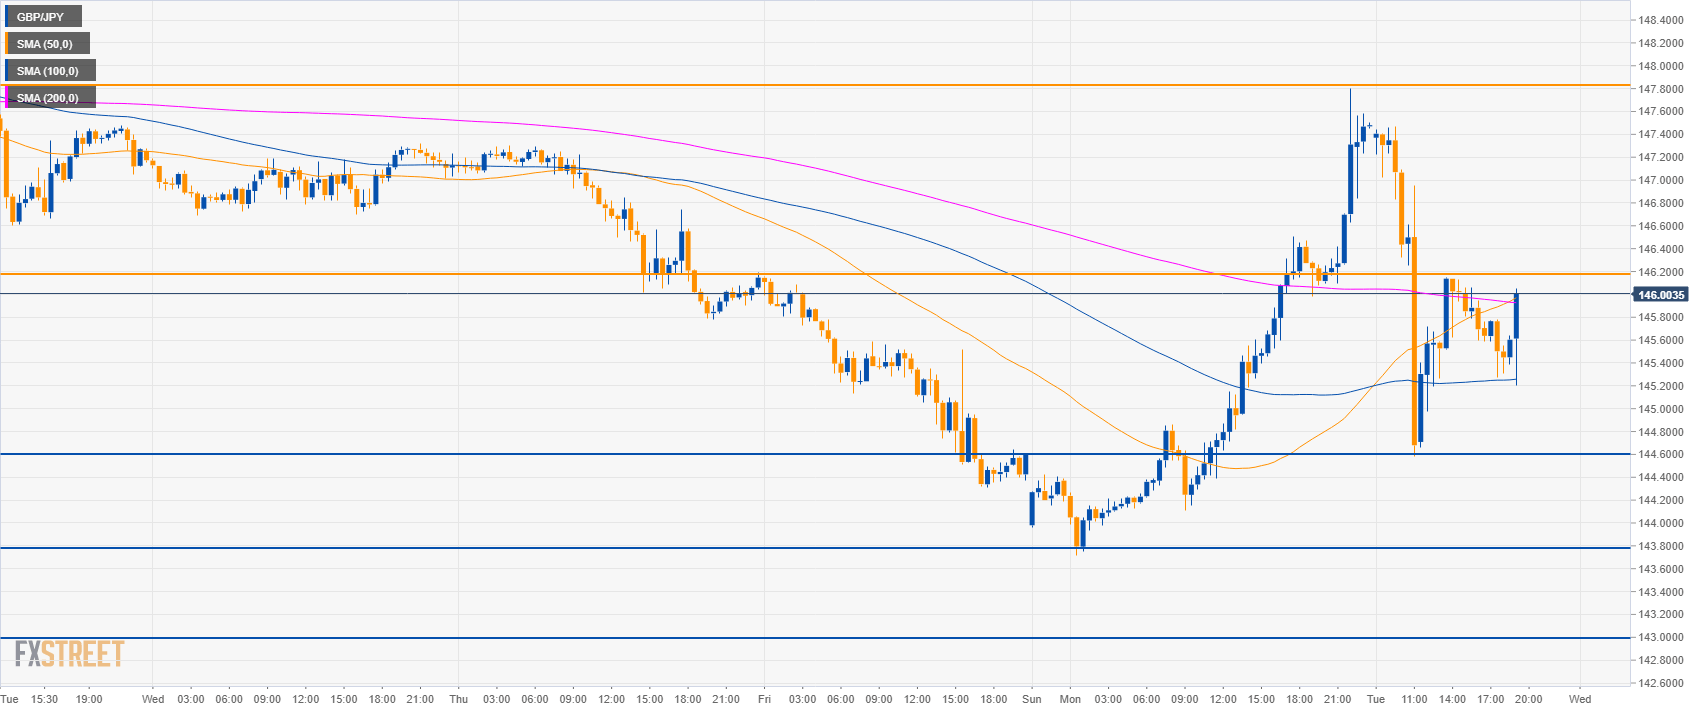
GBP/JPY 30-minute chart

  • GBP/JPY is trading between the 100 and 200 SMAs suggesting a sideways market in the short-term.
  • A break above 146.20 can lead to 147.80 resistance.
  • Support is at 146.60 and 143.00 level.

Additional key levels

GBP/JPY

Overview:
    Today Last Price: 145.32
    Today Daily change: -91 pips
    Today Daily change %: -0.62%
    Today Daily Open: 146.23
Trends:
    Daily SMA20: 145.19
    Daily SMA50: 142.71
    Daily SMA100: 143.44
    Daily SMA200: 144.66
Levels:
    Previous Daily High: 146.5
    Previous Daily Low: 143.72
    Previous Weekly High: 148.47
    Previous Weekly Low: 144.31
    Previous Monthly High: 148.28
    Previous Monthly Low: 141.01
    Daily Fibonacci 38.2%: 145.44
    Daily Fibonacci 61.8%: 144.78
    Daily Pivot Point S1: 144.47
    Daily Pivot Point S2: 142.7
    Daily Pivot Point S3: 141.68
    Daily Pivot Point R1: 147.25
    Daily Pivot Point R2: 148.27
    Daily Pivot Point R3: 150.03


Author

Flavio Tosti

Flavio Tosti

Independent Analyst


More from Flavio Tosti
Share:

Editor's Picks

EUR/USD recedes to daily lows near 1.1850

EUR/USD keeps its bearish momentum well in place, slipping back to the area of 1.1850 to hit daily lows on Monday. The pair’s continuation of the leg lower comes amid decent gains in the US Dollar in a context of scarce volatility and thin trade conditions due to the inactivity in the US markets.

GBP/USD flat lines near 1.3650 ahead of UK and US data

GBP/USD kicks off a new week on a subdued note and oscillates in a narrow range near 1.3650 on Monday. The mixed fundamental backdrop warrants some caution for aggressive traders as the market focus now shifts to this week's important data releases from the UK and the US.

Gold corrects lower, tries to stabilize above $5,000

Gold started the week under bearish pressure and declined to the $4,960 area before staging a modest rebound. As trading volumes remain thin with the US financial markets remaining closed on Presidents' Day holiday, XAU/USD looks to stabilize above $5,000 ahead of this week's key data releases.

Bitcoin consolidates as on-chain data show mixed signals

Bitcoin price has consolidated between $65,700 and $72,000 over the past nine days, with no clear directional bias. US-listed spot ETFs recorded a $359.91 million weekly outflow, marking the fourth consecutive week of withdrawals.

The week ahead: Key inflation readings and why the AI trade could be overdone

It is likely to be a quiet start to the week, with US markets closed on Monday for Presidents Day. European markets are higher across the board and gold is clinging to the $5,000 level after the tamer than expected CPI report in the US reduced haven flows to precious metals.

Monero Price Forecast: XMR risks a drop below $300 under mounting bearish pressure

Monero (XMR) starts the week under pressure, recording a 4% decline at press time on Monday after a 7% drop the previous day, putting the $300 support zone in focus.