GBP/JPY Technical Analysis: Sterling rises on UK PM May’s Brexit statement
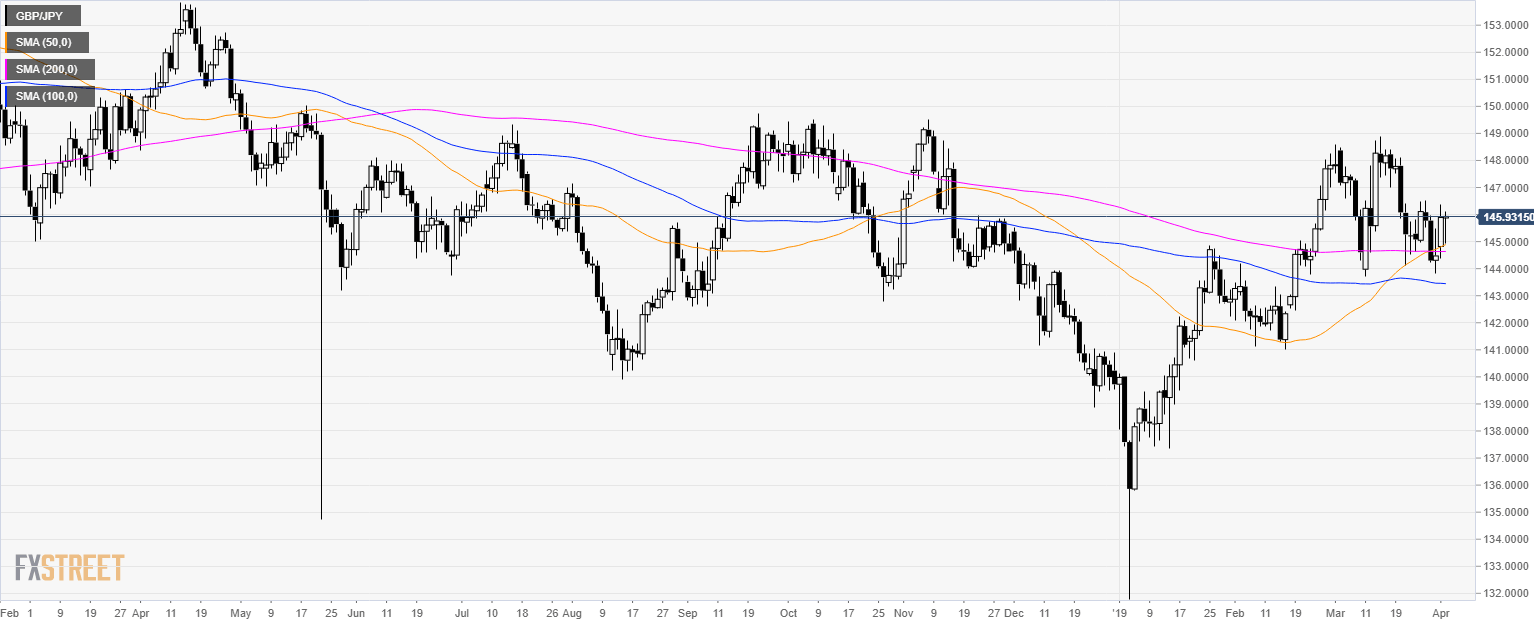

GBP/JPY daily chart


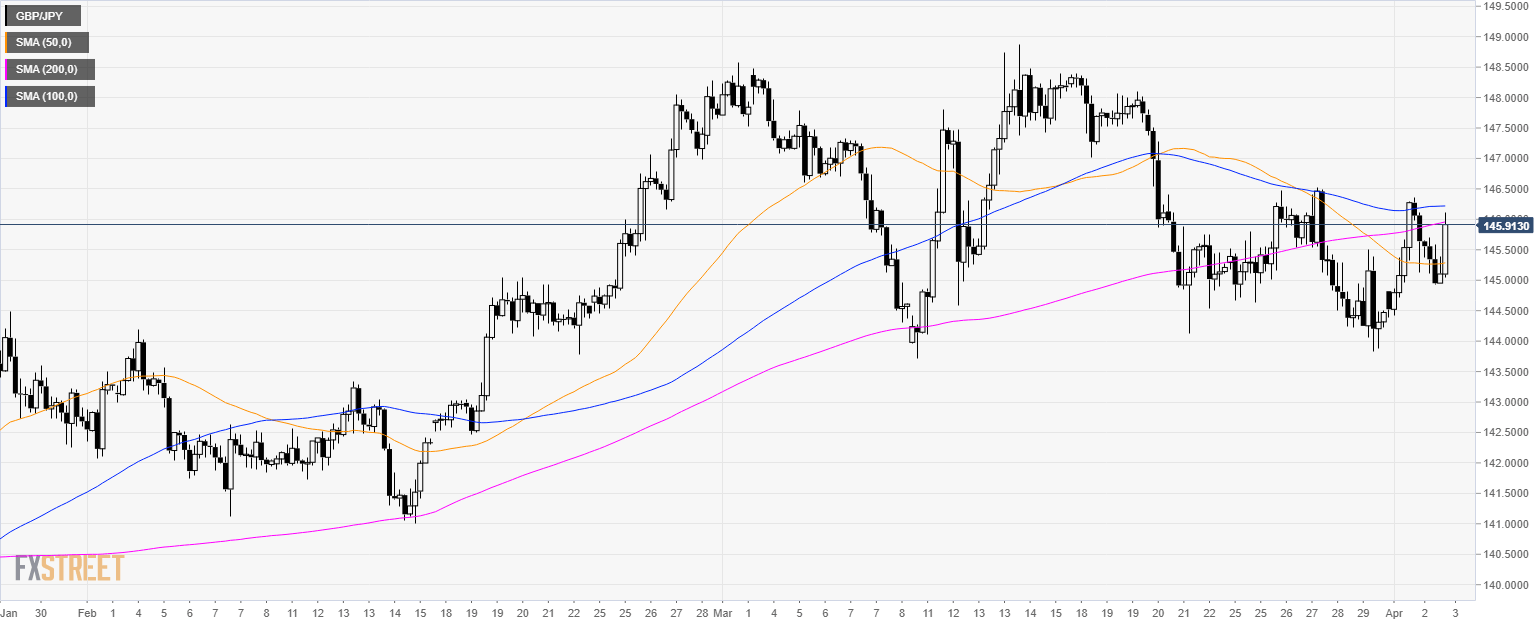
GBP/JPY 4-hour chart

  • GBP/JPY is testing the 146.00 figure and the 200 SMA.


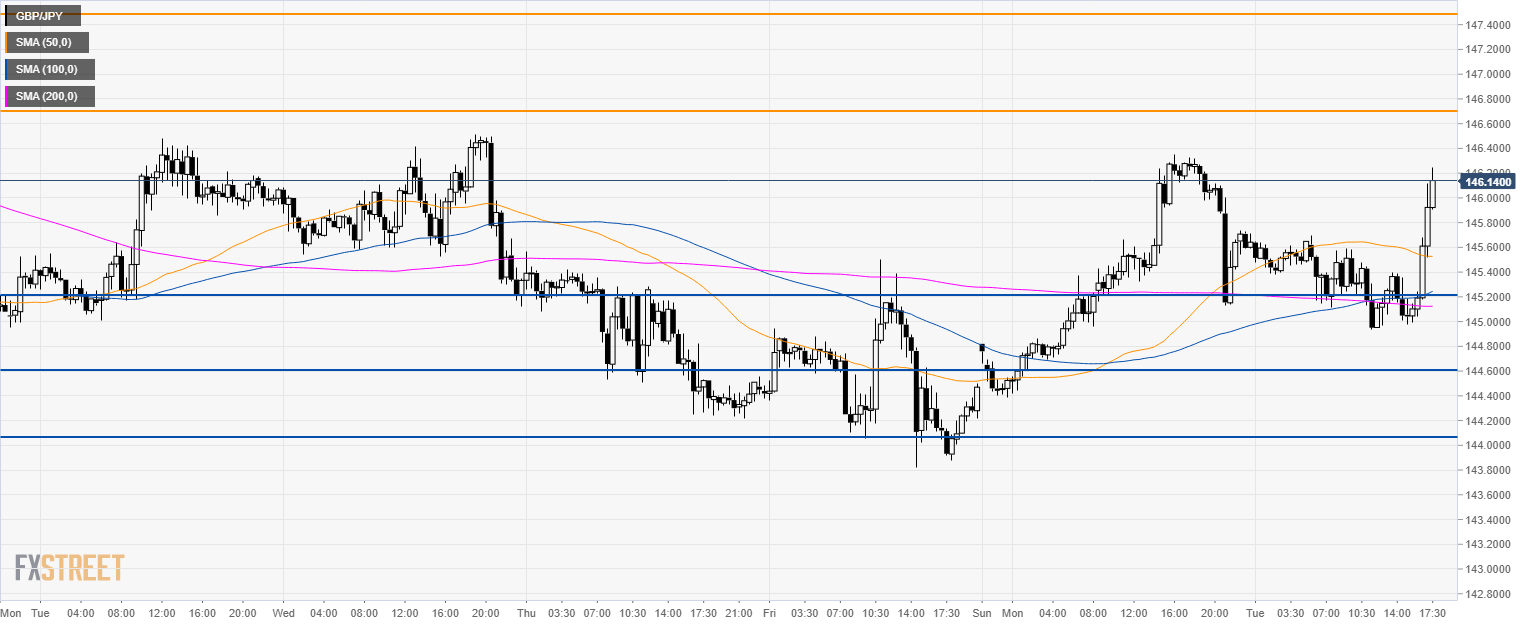
GBP/JPY 30-minute chart

  • GBP/JPY is trading above its main SMAs suggesting bullish momentum in the short-term.
  • Bulls are looking at the 146.70 and 147.50 resistances.
  • Supports are at 145.20, 144.60 and 144.05 level.


Additional key levels

GBP/JPY

Overview
Today last price 145.92
Today Daily Change 0.03
Today Daily Change % 0.02
Today daily open 145.89
 
Trends
Daily SMA20 146.25
Daily SMA50 144.81
Daily SMA100 143.46
Daily SMA200 144.64
Levels
Previous Daily High 146.35
Previous Daily Low 144.39
Previous Weekly High 146.52
Previous Weekly Low 143.82
Previous Monthly High 148.88
Previous Monthly Low 143.72
Daily Fibonacci 38.2% 145.6
Daily Fibonacci 61.8% 145.14
Daily Pivot Point S1 144.74
Daily Pivot Point S2 143.58
Daily Pivot Point S3 142.77
Daily Pivot Point R1 146.7
Daily Pivot Point R2 147.51
Daily Pivot Point R3 148.66


Share: Feed news

Note: All information on this page is subject to change. The use of this website constitutes acceptance of our user agreement. Please read our privacy policy and legal disclaimer. Opinions expressed at FXstreet.com are those of the individual authors and do not necessarily represent the opinion of FXstreet.com or its management. Risk Disclosure: Trading foreign exchange on margin carries a high level of risk, and may not be suitable for all investors. The high degree of leverage can work against you as well as for you. Before deciding to invest in foreign exchange you should carefully consider your investment objectives, level of experience, and risk appetite. The possibility exists that you could sustain a loss of some or all of your initial investment and therefore you should not invest money that you cannot afford to lose. You should be aware of all the risks associated with foreign exchange trading, and seek advice from an independent financial advisor if you have any doubts.

Recommended content


Recommended content

Editors’ Picks

AUD/USD could extend the recovery to 0.6500 and above

AUD/USD could extend the recovery to 0.6500 and above

The enhanced risk appetite and the weakening of the Greenback enabled AUD/USD to build on the promising start to the week and trade closer to the key barrier at 0.6500 the figure ahead of key inflation figures in Australia.

AUD/USD News

EUR/USD now refocuses on the 200-day SMA

EUR/USD now refocuses on the 200-day SMA

EUR/USD extended its positive momentum and rose above the 1.0700 yardstick, driven by the intense PMI-led retracement in the US Dollar as well as a prevailing risk-friendly environment in the FX universe.

EUR/USD News

Gold struggles around $2,325 despite broad US Dollar’s weakness

Gold struggles around $2,325 despite broad US Dollar’s weakness

Gold reversed its direction and rose to the $2,320 area, erasing a large portion of its daily losses in the process. The benchmark 10-year US Treasury bond yield stays in the red below 4.6% following the weak US PMI data and supports XAU/USD.

Gold News

Bitcoin price makes run for previous cycle highs as Morgan Stanley pushes BTC ETF exposure

Bitcoin price makes run for previous cycle highs as Morgan Stanley pushes BTC ETF exposure

Bitcoin (BTC) price strength continues to grow, three days after the fourth halving. Optimism continues to abound in the market as Bitcoiners envision a reclamation of previous cycle highs.

Read more

US versus the Eurozone: Inflation divergence causes monetary desynchronization

US versus the Eurozone: Inflation divergence causes monetary desynchronization

Historically there is a very close correlation between changes in US Treasury yields and German Bund yields. This is relevant at the current juncture, considering that the recent hawkish twist in the tone of the Federal Reserve might continue to push US long-term interest rates higher and put upward pressure on bond yields in the Eurozone. 

Read more

Forex MAJORS

Cryptocurrencies

Signatures