|
GBP/JPY Technical Analysis: Negative divergence on the hourly RSI
- GBP/JPY is solidly bid, having scaled the key falling trendline - drawn from April 18 high and April 26 high - on Friday.
- However, the bullish momentum may wane over the next few hours as the hourly RSI has not printed a higher high despite a higher high in price (bearish divergence).

Hourly chart
-636660956189782267.png)
Daily chart
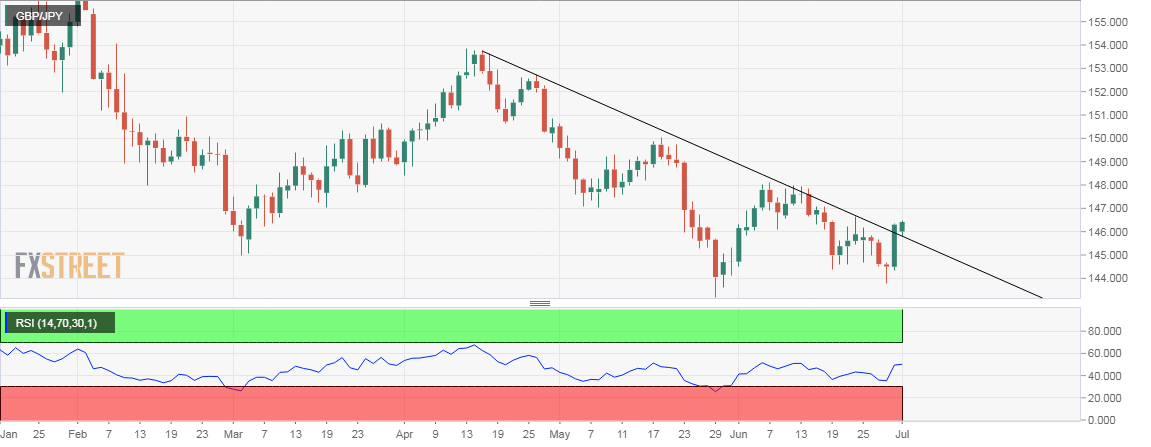
Spot Rate: 146.43
Daily High: 146.59
Daily Low: 145.77
Trend: Bullish move may stall
Resistance
R1: 146.65 (June 22 high)
R2: 147.00 (psychological hurdle)
R3: 147.40 (50-day MA)
Support
S1: 146.00 (psychological support)
S2: 145.77 (support on hourly chart)
S3: 145.32 (200-hour MA)
Author

Omkar Godbole
FXStreet Contributor
Omkar Godbole, editor and analyst, joined FXStreet after four years as a research analyst at several Indian brokerage companies.
More from Omkar Godbole


