|

GBP/JPY skids along the bottom, bears looking for 181.00

  • The GBP/JPY consolidated in the back half of Tuesday trading, pinned to the low side just above 181.00.
  • The Guppy is down from Tuesday's opening bids near 181.80.
  • Broader market risk appetite burst into flames on Tuesday, but Yen traders are leery ahead of Japan inflation figures.

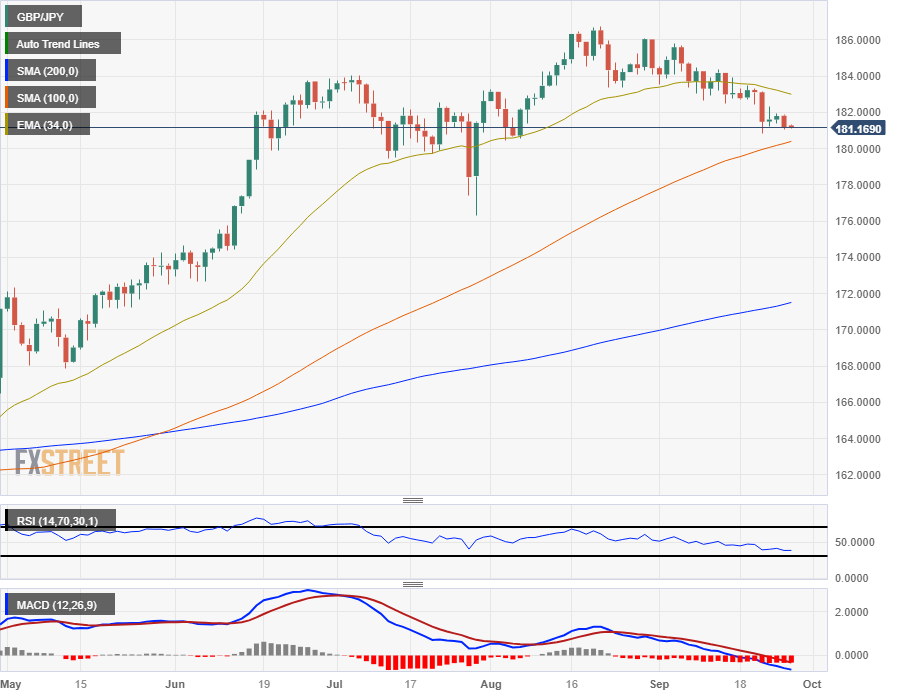
The GBP/JPY is down nearly 80 pips heading into the Wednesday market session, with the Pound Sterling (GBP) continuing to flag against the Japanese Yen (JPY). The pair is down almost 1.3% from last week's peak, and in the red over 3.0% from August's peak of 186.77.

The mid-week is thin on the economic calendar for the Guppy, and traders will be looking ahead to Thursday's Tokyo Consumer Price Index (CPI) reading on Thursday, which will be followed by Friday's Gross Domestic Product (GDP) figures for the UK.

The Bank of Japan (BoJ) is determined to see Japanese inflation remain above 2% in a meaningful way before stepping away from its hyper-easy monetary policy regime. Japanese interest rates are currently at -0.1%, and despite inflation being over the BoJ's 2% target, fears of an inflation collapse are plaguing the BoJ.

Investors will be keeping a close eye on Thursday's Tokyo CPI reading for September, which last printed at 2.9% for the annualized period into August.

Japan's Tokyo CPI data drops late Thursday at 23:30 GMT.

Friday will bring an end-of-week juggle for the GBP, with UK GDP figures in the pipe; laboring economic growth remains a key sticking point for the Bank of England (BoE), and UK GDP is forecast to hold steady at 0.2% for the second quarter.

GBP/JPY technical outlook

Intraday action for the GPB/JPY is decidedly bearish, with prices slumping away from the 34-hour Exponential Moving Average (EMA) near 181.40 and the 200-hour Simple Moving Average (SMA) well above current price action at 182.40.

Daily candlesticks see the Guppy on the downside as well, with the pair drifting into the 100-day SMA just above the 180.00 major handle. Despite recent bearish momentum, the GBP/JPY has soared in the medium-term and still remains almost 17% higher for the year.

Technical indicators are drifting into oversold territory thanks to the last six weeks' gradual decline, and the Relative Strength Index (RSI) is set to ping the lower boundary indicating overextended selling pressure.

GBP/JPY daily chart

GBP/JPY technical levels

GBP/JPY

Overview
Today last price181.18
Today Daily Change-0.62
Today Daily Change %-0.34
Today daily open181.8
 
Trends
Daily SMA20183.68
Daily SMA50183.27
Daily SMA100180.18
Daily SMA200171.31
 
Levels
Previous Daily High181.96
Previous Daily Low181.41
Previous Weekly High183.49
Previous Weekly Low180.82
Previous Monthly High186.77
Previous Monthly Low180.46
Daily Fibonacci 38.2%181.75
Daily Fibonacci 61.8%181.62
Daily Pivot Point S1181.49
Daily Pivot Point S2181.17
Daily Pivot Point S3180.94
Daily Pivot Point R1182.04
Daily Pivot Point R2182.27
Daily Pivot Point R3182.59

Author

Joshua Gibson

Joshua joins the FXStreet team as an Economics and Finance double major from Vancouver Island University with twelve years' experience as an independent trader focusing on technical analysis.

More from Joshua Gibson
Share:

Editor's Picks

GBP/USD loses momentum, flirts with 1.3200

GBP/USD is struggling to maintain its positive bias on Thursday, retreating toward the 1.3200 region in response to the pick in the buying interest around the Greenback. That said, Cable remains under scrutiny as cautious market sentiment keeps investors focused on the US-Iran conflict and political effervescence in the UK.

EUR/USD trims gains, challenges 1.1400

EUR/USD now gives away part of its earlier advance, receding toward the 1.1400 contention zone on Thursday. Meanwhile, the pair’s recovery comes amid extra losses in the US Dollar, at the time when while investors continue to monitor developments in the Middle East and sentiment surrounding global technology stocks.

Gold remains bid and close to $4,100

Gold accelerates its recovery and approaches the key $4,000 mark per troy ounce at the end of the week, adding to Thursday’s advance. However, expectations for a hawkish Fed remain steady and keep the yellow metal’s potential upside contained.

Crypto Today: Bitcoin at $60,000, Ethereum at $1,500, and XRP at $1 face a make-or-break test

Bitcoin (BTC), Ethereum (ETH), and Ripple (XRP) are trading in the red on Friday after three consecutive days of losses, testing their respective make-or-break support levels.

Week ahead – NFP report to challenge Dollar strength and the hawkish Fed

Dollar strength dominates markets, as the hawkish Fed overshadows geopolitics and lower oil prices. NFP week could drive September Fed hike expectations and boost market volatility. The euro lacks fresh bullish catalysts, all eyes on the preliminary inflation report and the ECB Forum.

Regime change: Inside Kevin Warsh's first move to make the Fed unreadable on purpose

The rate did not move. That was the least interesting thing about Kevin Warsh's first meeting in charge of the Fed. The FOMC held its benchmark at 3.50%-3.75% for the fourth straight meeting, exactly as priced, and then the new chair used his first press conference to dismantle the machinery the market has leaned on for a decade.