GBP/JPY Price Prediction: Pulling back within established short-term downtrend
- GBP/JPY is correcting within a short-term downtrend.
- The odds favor a resumption lower once the correction completes.

GBP/JPY has pulled back up to resistance at 186.51 in a counter-trend reaction after plumbing new lows.
The descending sequence of peaks and troughs since the September 2 high suggests the pair is in a short-term downtrend.
GBP/JPY 4-hour Chart
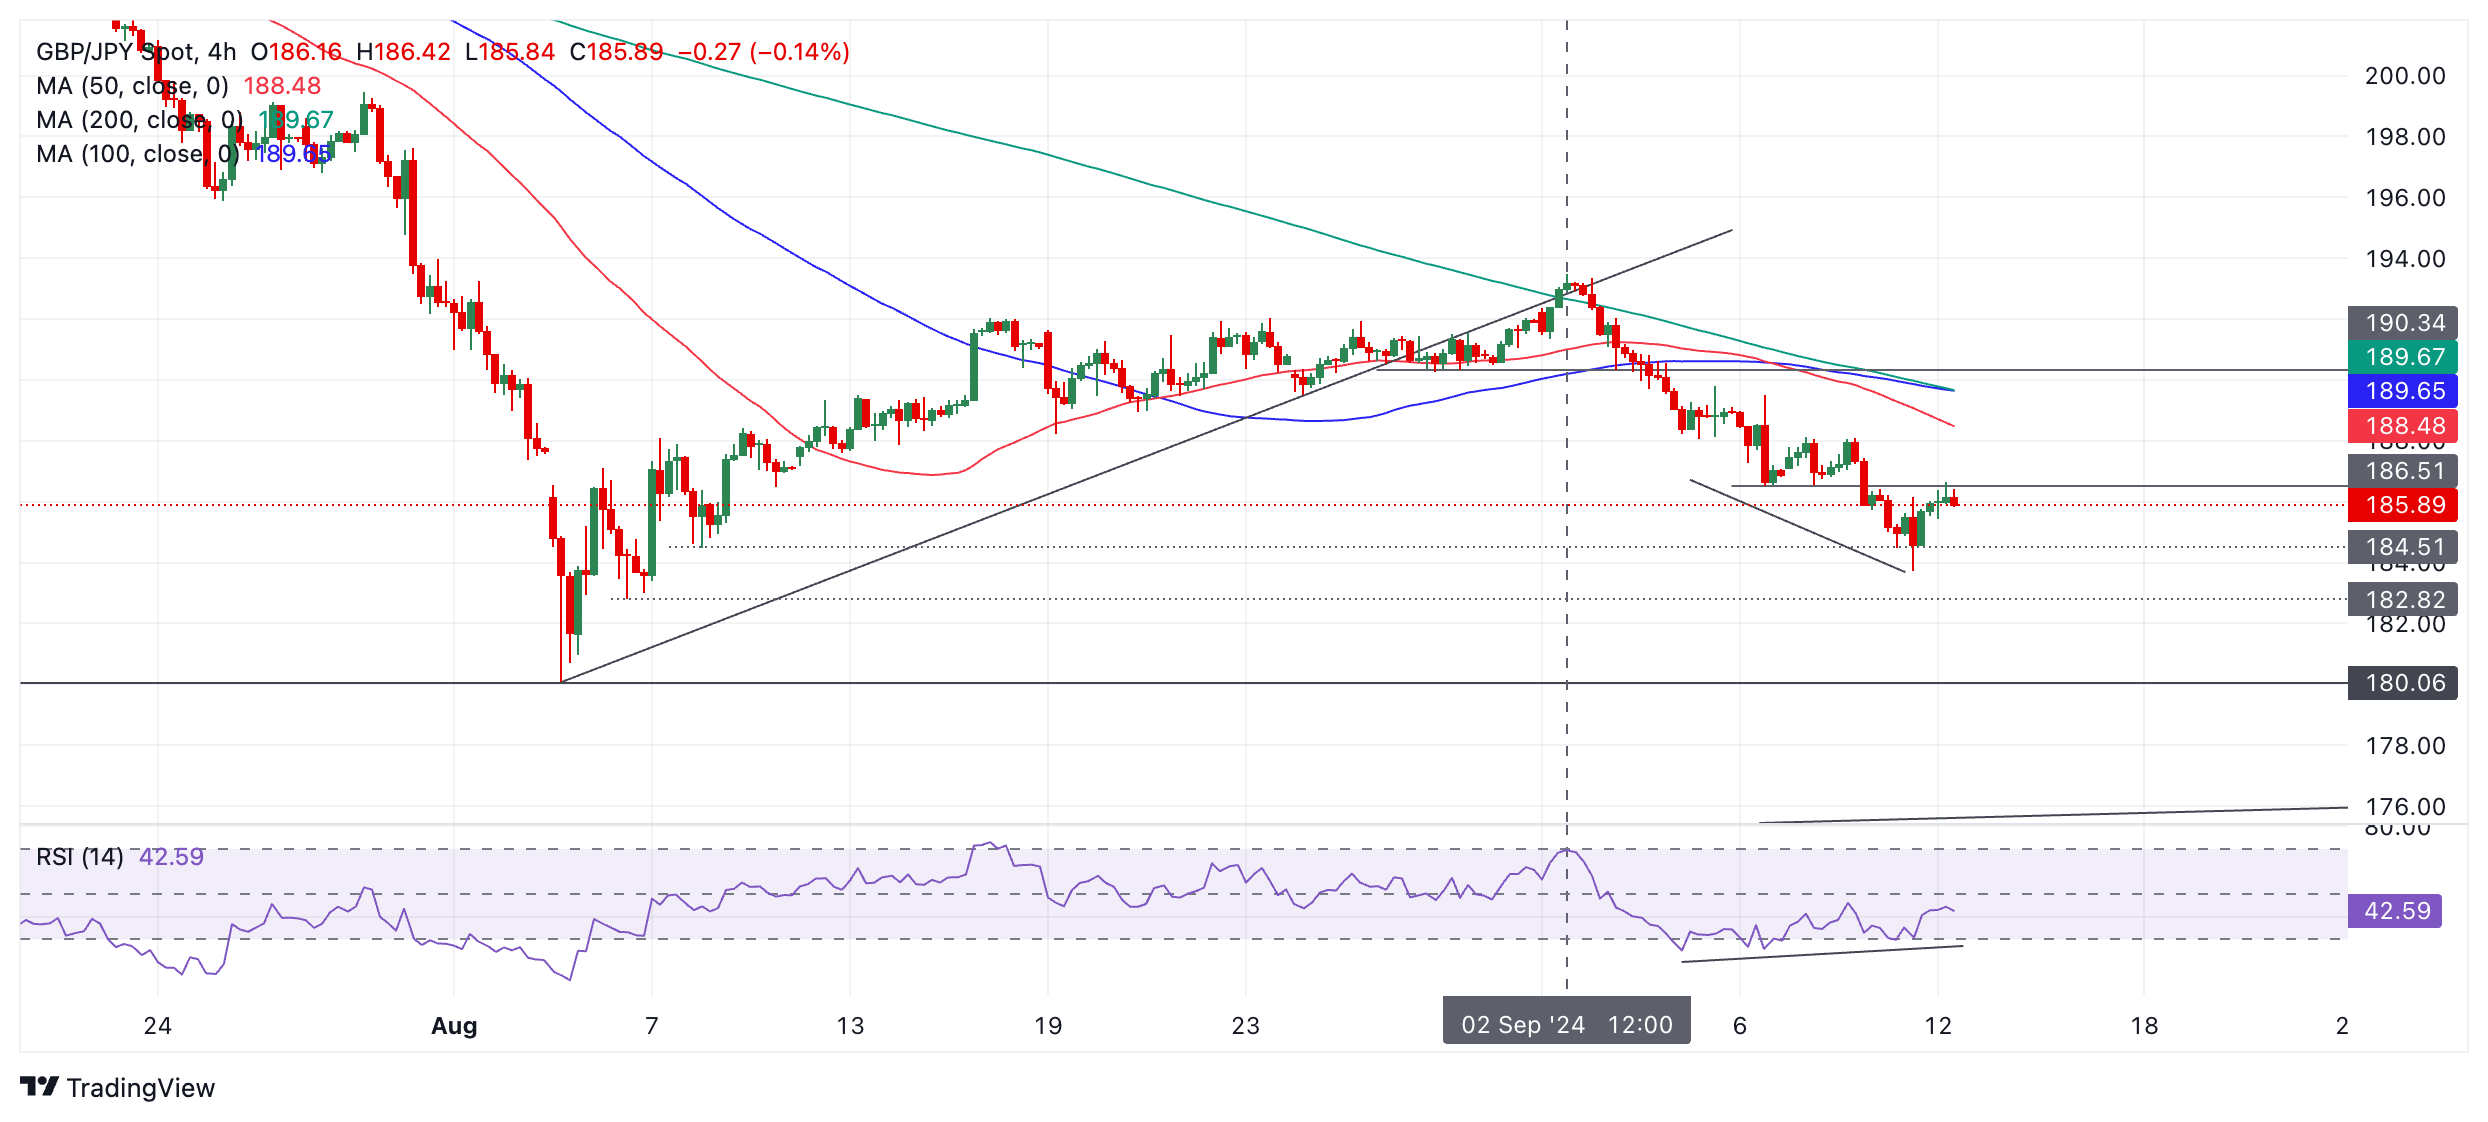
Since it is a principle of technical analysis that “the trend is your friend,” more weakness is expected.
There is every chance, therefore, that the pullback will soon run out of steam and prices will resume their downtrend.
A break below the 183.72 (September 11 low) would confirm a lower low to the next bearish target at 182.82 (August 6 swing low), followed by 180.06, the low of August 5.
The Relative Strength Index (RSI) momentum indicator is showing bullish convergence with price. On September 4, the RSI entered oversold territory when the price bottomed; on September 12, the price is even lower, but the RSI is actually higher. The non-correspondence is a mildly bullish indication.
Author

Joaquin Monfort
FXStreet
Joaquin Monfort is a financial writer and analyst with over 10 years experience writing about financial markets and alt data. He holds a degree in Anthropology from London University and a Diploma in Technical analysis.


