GBP/JPY Price Forecast: Strengthens above 193.00, overbought RSI warrants caution for bulls
- GBP/JPY gains ground to near 193.25 in Friday’s early European session.
- The positive bias of the cross prevails above the 100-day EMA, but overbought RSI condition might cap its upside.
- The immediate resistance level emerges at 193.75; the first downside target to watch is 191.73.

The GBP/JPY cross drifts higher to near 193.25 during the early European session on Friday. The Japanese Yen (JPY) weakens against the Pound Sterling (GBP) as traders scale back their bets on further interest-rate hikes by the Bank of Japan (BoJ).
On Thursday, the BoJ kept short-term interest rates steady at 0.5% and slashed its forecasts for economic growth and inflation for the current year amid heightened trade uncertainty. Furthermore, the improved sentiment in the financial markets due to optimism about a de-escalation in the global trade conflict weighs on the safe-haven currency like the JPY and acts as a tailwind for GBP/JPY.
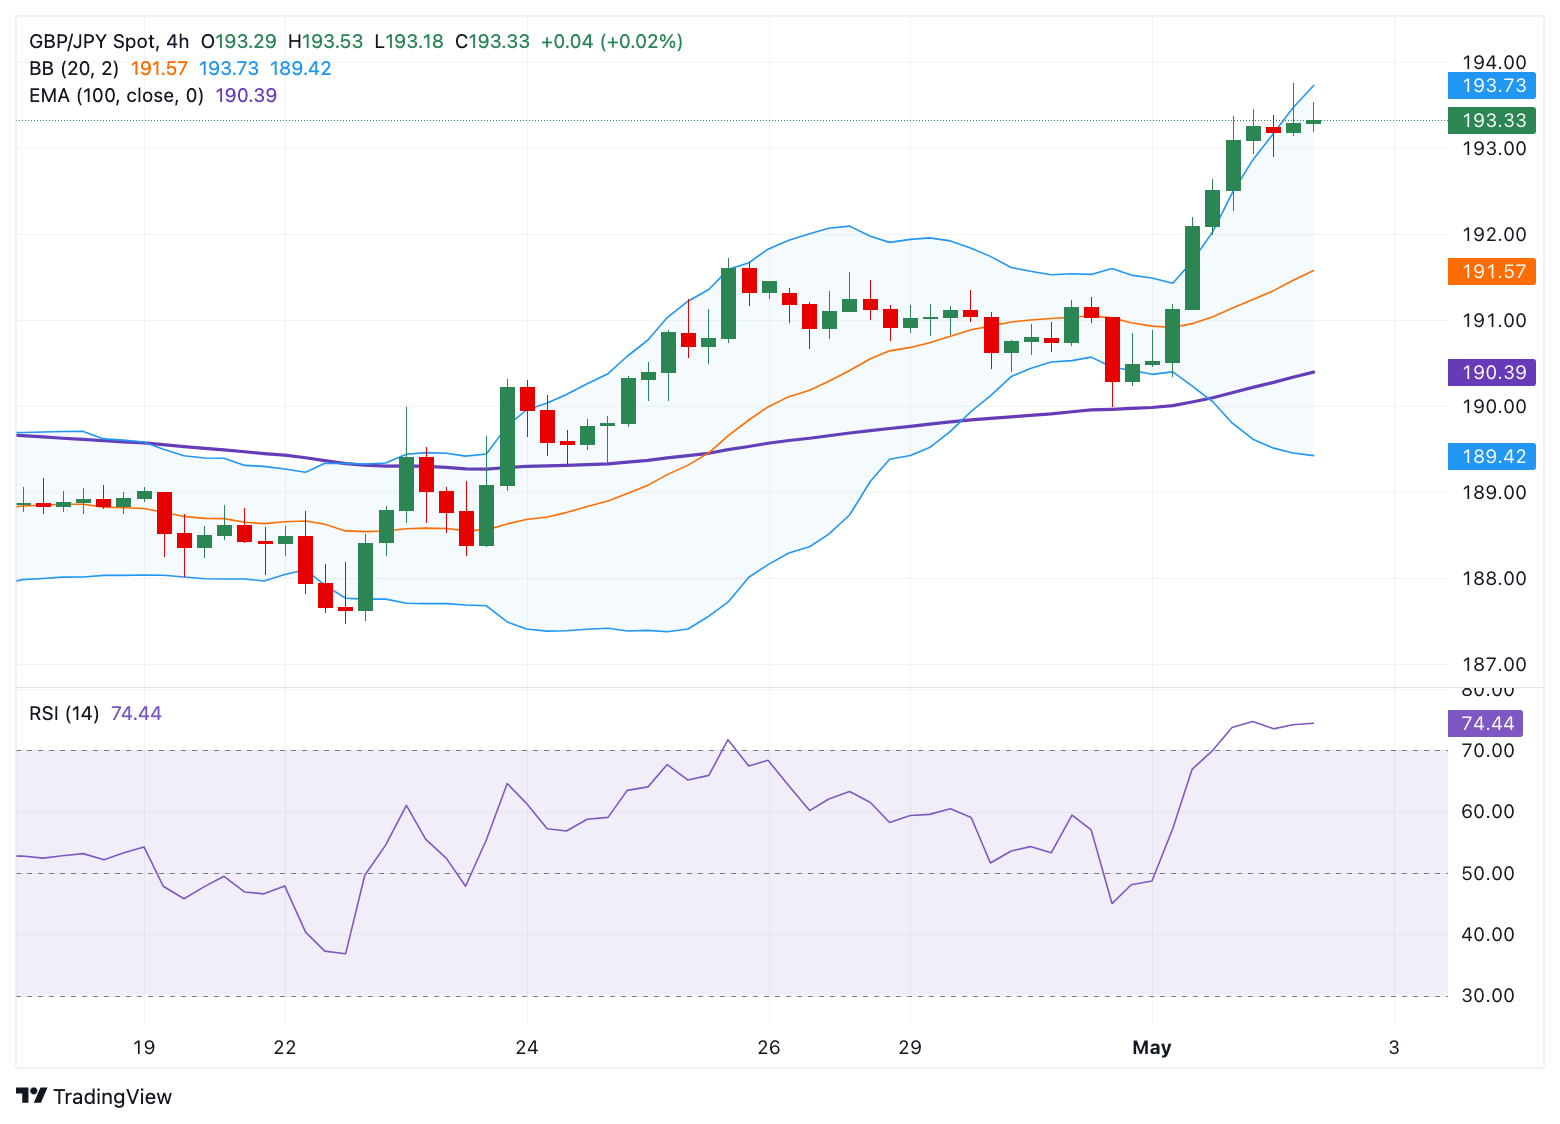
According to the 4-hour chart, the constructive outlook of GBP/JPY remains intact as the cross holds above the key 100-period Exponential Moving Averages (EMA). However, the Relative Strength Index (RSI) stands above the midline near 74.70, indicating the overbought RSI condition. This suggests that further consolidation cannot be ruled out before positioning for any near-term GBP/JPY appreciation.
The upper boundary of the Bollinger Band and the high of May 2 at 193.75 act as an immediate resistance level for the cross. A decisive break above this level could see a rally to 194.80, the high of March. Further north, the next hurdle to watch is 195.78, the high of April 3.
In the bearish case, the initial support level is located at 191.73, the high of April 25. Any follow-through selling below the mentioned level could expose the 190.00 psychological mark. Extended losses could see a drop to 189.43, the lower limit of the Bollinger Band.
GBP/JPY 4-hour chart
Japanese Yen FAQs
The Japanese Yen (JPY) is one of the world’s most traded currencies. Its value is broadly determined by the performance of the Japanese economy, but more specifically by the Bank of Japan’s policy, the differential between Japanese and US bond yields, or risk sentiment among traders, among other factors.
One of the Bank of Japan’s mandates is currency control, so its moves are key for the Yen. The BoJ has directly intervened in currency markets sometimes, generally to lower the value of the Yen, although it refrains from doing it often due to political concerns of its main trading partners. The BoJ ultra-loose monetary policy between 2013 and 2024 caused the Yen to depreciate against its main currency peers due to an increasing policy divergence between the Bank of Japan and other main central banks. More recently, the gradually unwinding of this ultra-loose policy has given some support to the Yen.
Over the last decade, the BoJ’s stance of sticking to ultra-loose monetary policy has led to a widening policy divergence with other central banks, particularly with the US Federal Reserve. This supported a widening of the differential between the 10-year US and Japanese bonds, which favored the US Dollar against the Japanese Yen. The BoJ decision in 2024 to gradually abandon the ultra-loose policy, coupled with interest-rate cuts in other major central banks, is narrowing this differential.
The Japanese Yen is often seen as a safe-haven investment. This means that in times of market stress, investors are more likely to put their money in the Japanese currency due to its supposed reliability and stability. Turbulent times are likely to strengthen the Yen’s value against other currencies seen as more risky to invest in.
BRANDED CONTENT
Choosing a broker that aligns with your trading needs can significantly impact performance. Our list of the best regulated brokers highlights the best options for seamless and cost-effective trading.
Author

Lallalit Srijandorn
FXStreet
Lallalit Srijandorn is a Parisian at heart. She has lived in France since 2019 and now becomes a digital entrepreneur based in Paris and Bangkok.


