GBP/JPY Price Analysis: Tests nine-day EMA barrier near 200.00 ahead of UK PMI figures
- GBP/JPY tests its initial resistance at the nine-day EMA of 199.81.
- The 14-day Relative Strength Index remains above 50, strengthening the bullish bias.
- The primary support lies at the crucial level of 199.50.

GBP/JPY extends its gains for the second successive session, trading around 199.70 during the European hours on Tuesday. The currency cross appreciates ahead of the United Kingdom’s (UK) S&P Global Purchasing Managers’ Index (PMI) data for September.
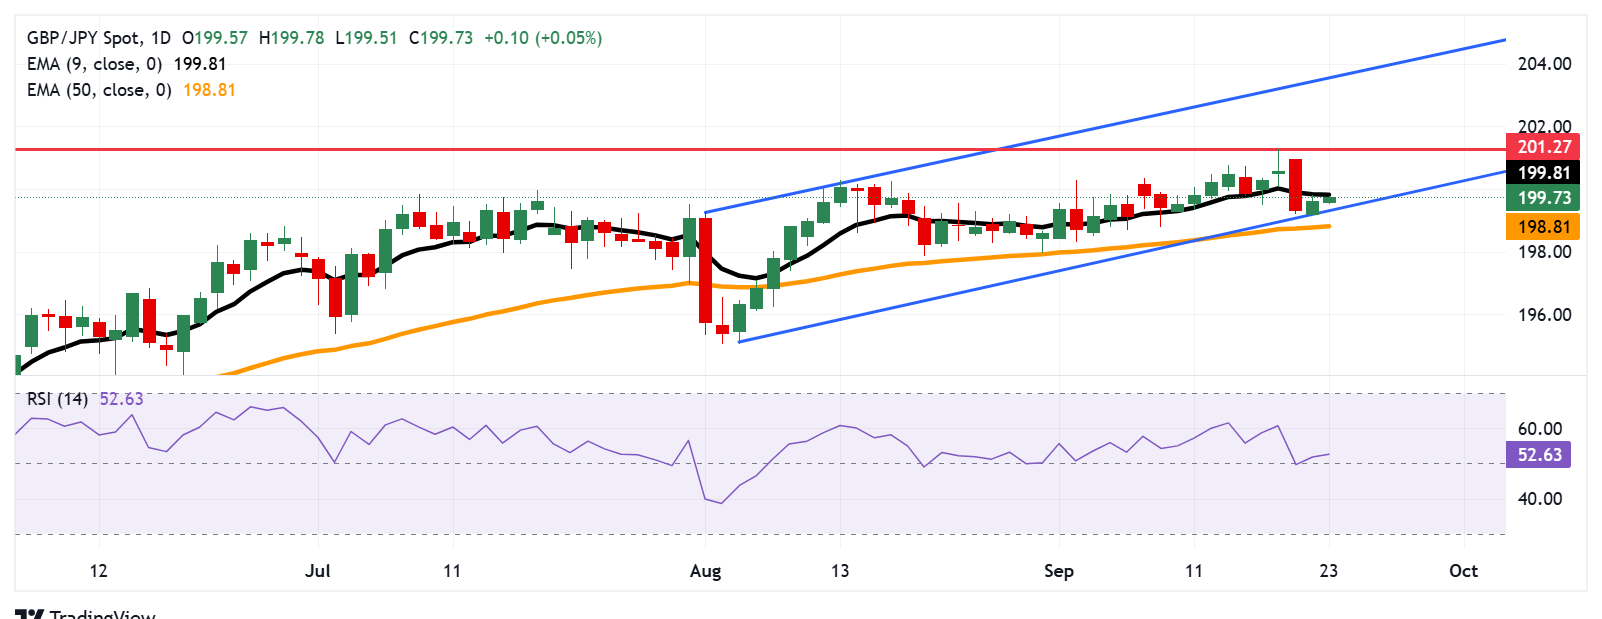
A look at the daily chart suggested the GBP/JPY cross is remaining within an ascending channel pattern, suggesting the market bias is bullish. Additionally, the 14-day Relative Strength Index (RSI), a key momentum gauge, is positioned slightly above the 50 mark, strengthening the bullish bias. However, the currency cross is still slightly below the nine-day Exponential Moving Average (EMA), suggesting that short-term price momentum is weaker. A break above the nine-day EMA would offer bullish confirmation.
The GBP/JPY cross is testing its immediate barrier at the nine-day EMA of 199.81, followed by the psychological level of 200.00. A break above this resistance zone would improve the short-term price momentum and support the currency cross to approach the 14-month high of 201.27, which was reached on September 18. Further advances support the market bias and prompt the currency cross to explore the region around the ascending channel’s upper boundary at 203.60.
On the downside, the currency cross may retest the crucial support level at 199.50, followed by the lower boundary of the ascending channel around 199.40. A break below the channel would weaken the bullish bias and put downward pressure on the GBP/JPY cross to test the 50-day EMA at 198.81.
GBP/JPY: Daily Chart
Pound Sterling Price Today
The table below shows the percentage change of British Pound (GBP) against listed major currencies today. British Pound was the strongest against the New Zealand Dollar.
| USD | EUR | GBP | JPY | CAD | AUD | NZD | CHF | |
|---|---|---|---|---|---|---|---|---|
| USD | 0.14% | -0.13% | -0.01% | 0.19% | 0.15% | 0.25% | -0.05% | |
| EUR | -0.14% | -0.13% | -0.12% | 0.10% | 0.09% | 0.17% | -0.13% | |
| GBP | 0.13% | 0.13% | 0.08% | 0.24% | 0.22% | 0.29% | 0.00% | |
| JPY | 0.01% | 0.12% | -0.08% | 0.18% | 0.19% | 0.24% | 0.04% | |
| CAD | -0.19% | -0.10% | -0.24% | -0.18% | -0.03% | 0.06% | -0.24% | |
| AUD | -0.15% | -0.09% | -0.22% | -0.19% | 0.03% | 0.08% | -0.13% | |
| NZD | -0.25% | -0.17% | -0.29% | -0.24% | -0.06% | -0.08% | -0.29% | |
| CHF | 0.05% | 0.13% | -0.00% | -0.04% | 0.24% | 0.13% | 0.29% |
The heat map shows percentage changes of major currencies against each other. The base currency is picked from the left column, while the quote currency is picked from the top row. For example, if you pick the British Pound from the left column and move along the horizontal line to the US Dollar, the percentage change displayed in the box will represent GBP (base)/USD (quote).
Author

Akhtar Faruqui
FXStreet
Akhtar Faruqui is a Forex Analyst based in New Delhi, India. With a keen eye for market trends and a passion for dissecting complex financial dynamics, he is dedicated to delivering accurate and insightful Forex news and analysis.


