GBP/JPY Price Analysis: Tanks to fresh two-week lows as a double-top emerges
- GBP/JPY sank close to 250 pips on Thursday, erasing Wednesday’s gains.
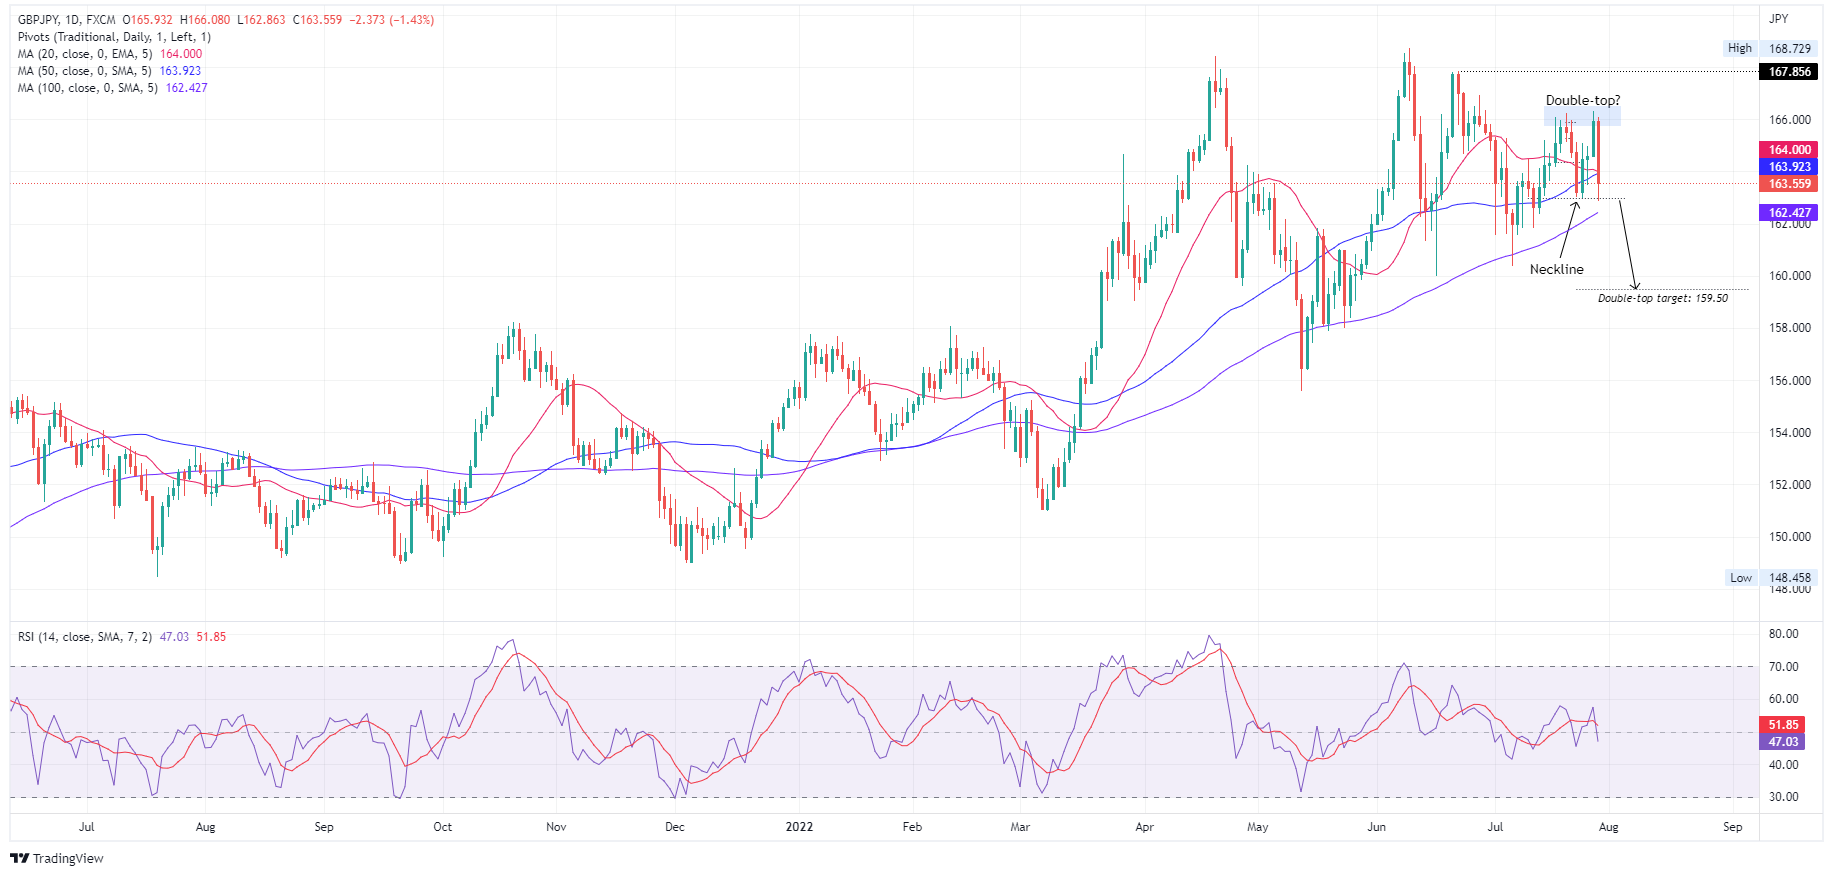
- The GBP/JPY daily chart is neutral-biased, but a double-top tilts the bias downwards.
- GBP/JPY Price Analysis: If sellers reclaim 163.00, a dive towards 161.00 is on the cards.

The GBP/JPY erases Wednesday’s gains and tanks more than 250 pips as traders assess the US Federal Reserve commentary, but also due to the US Advanced GDP for the Q2 contracting, meaning that the country is in a “technical recession.” In the FX space, investors flew towards safe-haven assets, with the Japanese yen being the best performer, appreciating the most vs. the greenback since March 2020. At the time of writing, the GBP/JPY is trading at 163.50.
GBP/JPY Price Analysis: Technical outlook
The GBP/JPY daily chart depicts the pair as neutral biased, once it cleared on its way south, the 20 and 50-day EMAs. Additionally, a double-top formed, and even though Thursday’s low broke below the neckline, sellers lost steam, giving way to some buying pressure. However, if GBP/JPY sellers reclaim 163.00, they will challenge the July 12 low at 161.82, followed by the double-top target at 159.50.
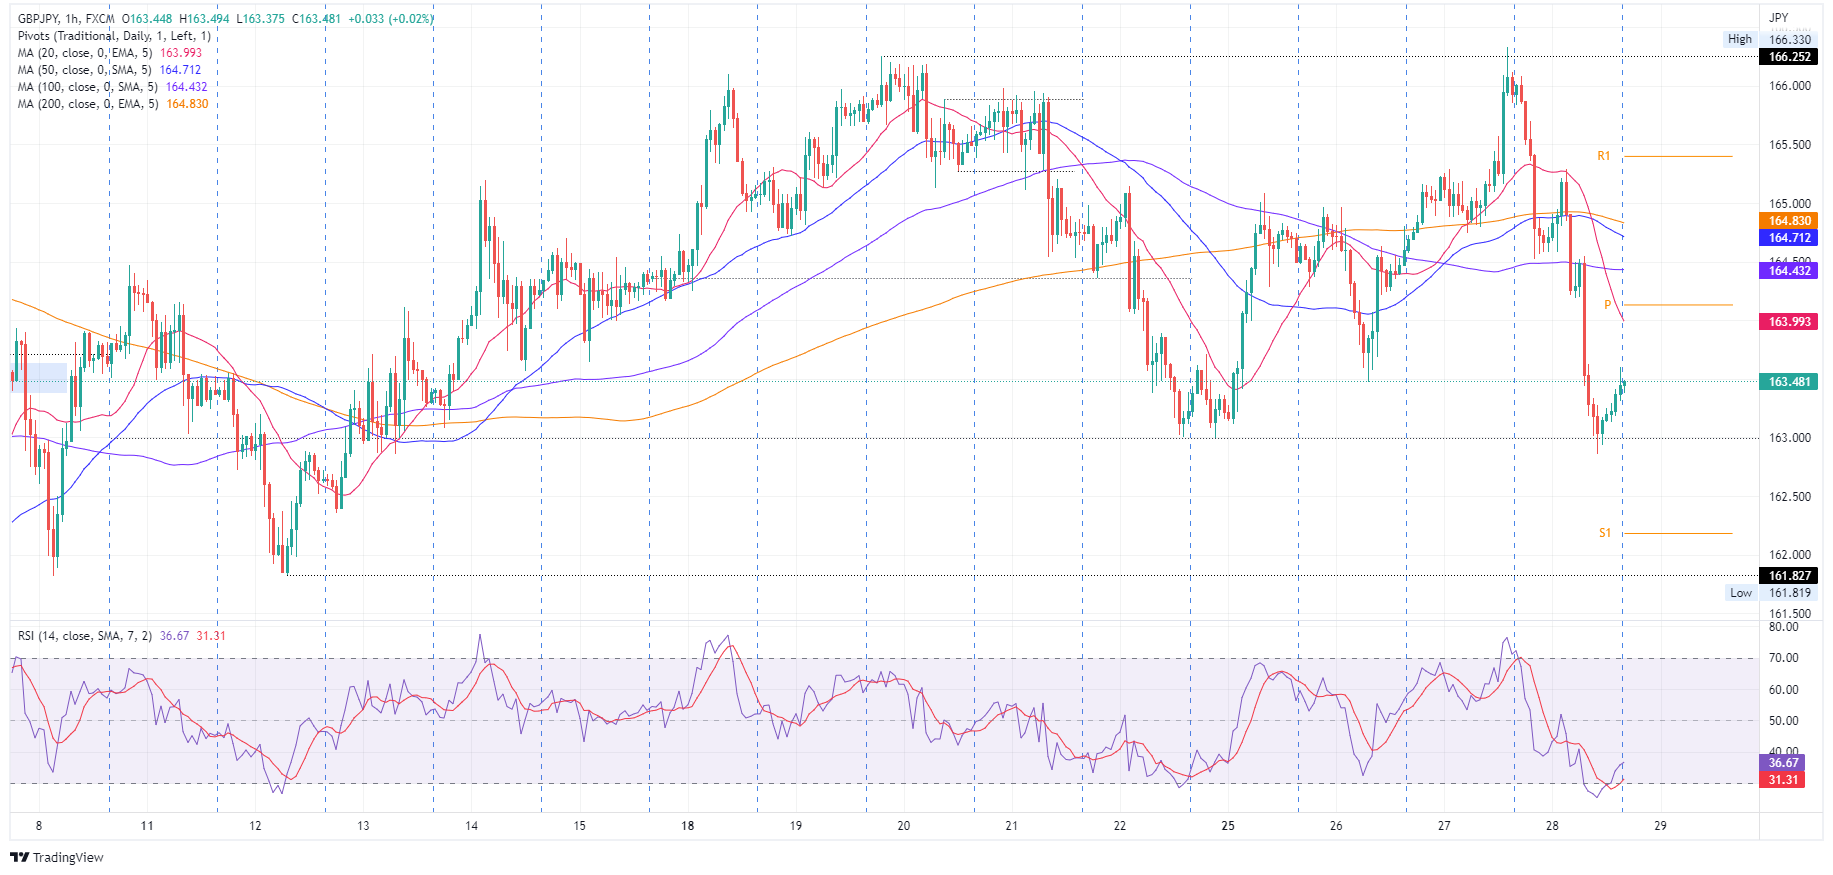
GBP/JPY 1-hour chart
The GBP/JPY further cemented the neutral bias, with price action stuck between the 163.00-166.00 range. However, Thursday’s price action tilted the tendency downwards, as the GBP/JPY exchange rate tumbled below all the hourly EMAs. Therefore, the GBP/JPY is neutral-to-downward biased.
That said the GBP/JPY first support would be the 163.00 figure. The break below will expose the S1 daily pivot at 162.17, followed by the S2 pivot point at 160.92.
GBP/JPY Key Technical Levels
Author

Christian Borjon Valencia
FXStreet
Christian Borjon began his career as a retail trader in 2010, mainly focused on technical analysis and strategies around it. He started as a swing trader, as he used to work in another industry unrelated to the financial markets.


