GBP/JPY Price Analysis: Subdued below the 78.6% Fibonacci, as sellers gain momentum


  • The GBP/JPY daily chart delineates the pair as neutral-biased from a technical perspective.
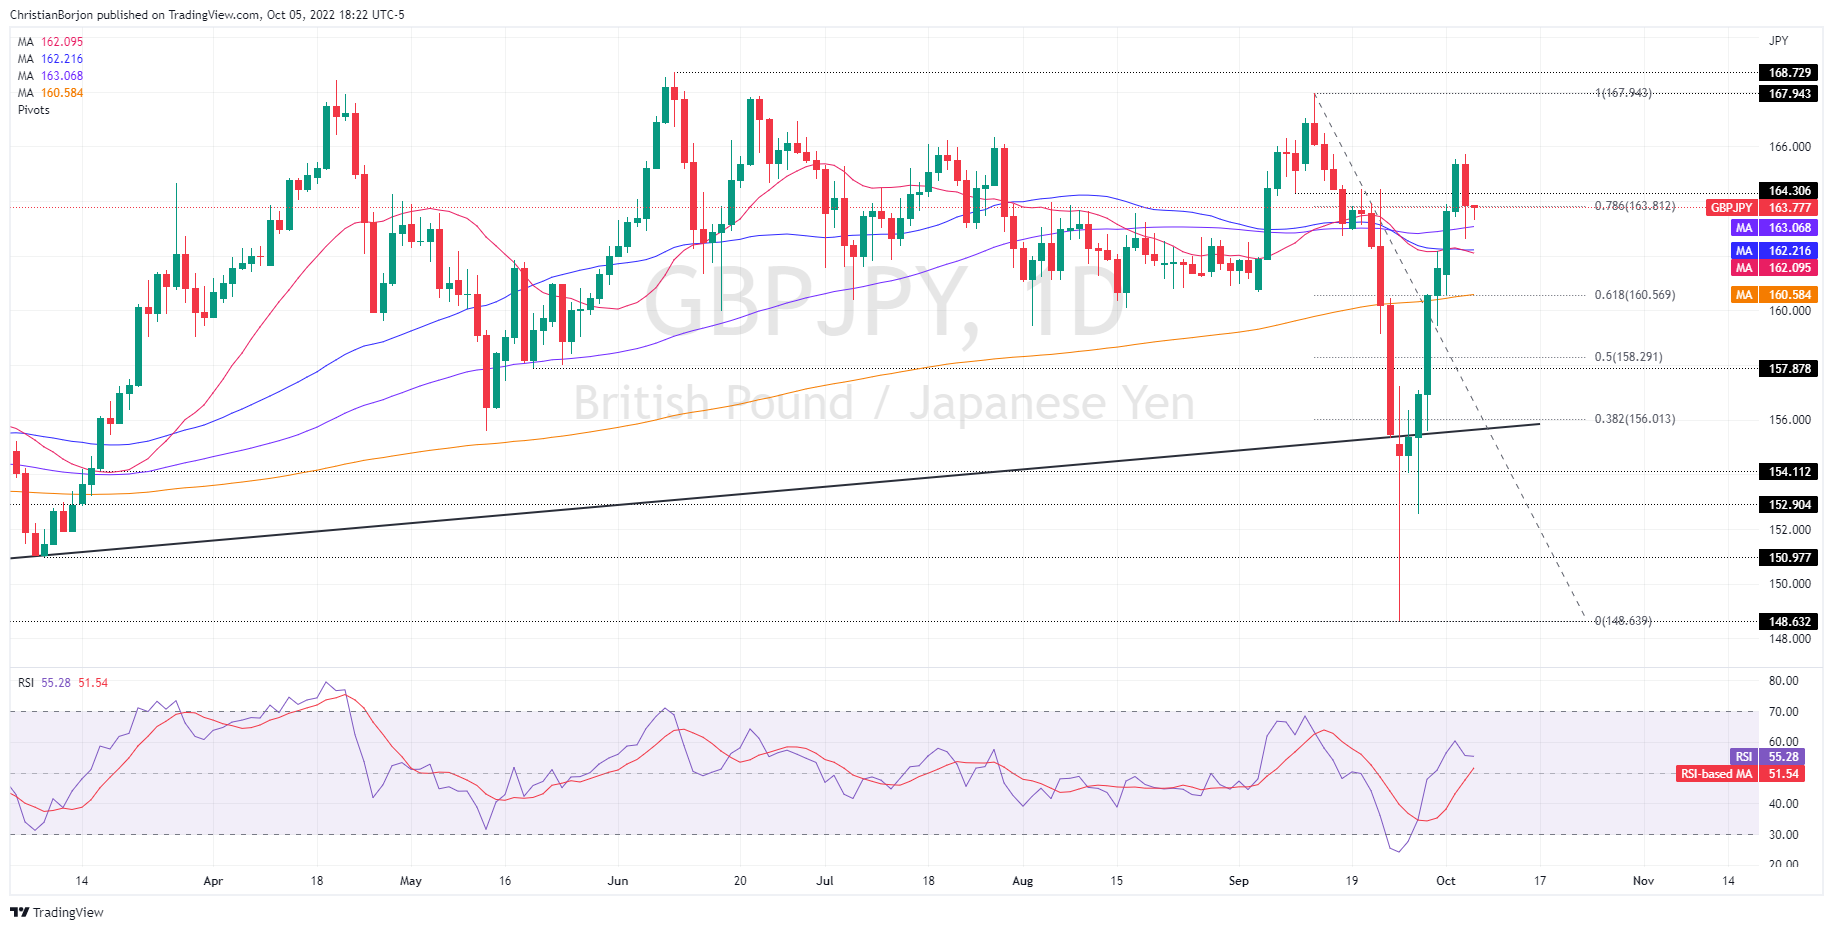
  • However, the pair meanders around the 78.6% Fibonacci retracement, which, once broken, will resume the GBP/JPY downtrend.
  • Contrarily, a break above 164.00 could open the door for a re-test of the weekly high.

The GBP/JPY reached a fresh weekly high on Wednesday at 165.71 but plunged towards its daily low at 162.60 before retracing to current exchange rates for some reasons. Firstly, expectations of a possible Fed pivot extended the GBP/JPY uptrend since Monday. Nevertheless, Fed officials’ rhetoric emphasized the need for higher rates for longer, spurring a risk-off impulse. Therefore, as the Asian session begins, the GBP/JPY is trading at 163.77, below its opening price.

The GBP/JPY is neutral-biased from a daily chart perspective, even though the pair managed to stay above the 100, 50, and 20-day EMAs. Nevertheless, it’s meandering around the 78.6% Fibonacci level, drawn from the September 13-26 high at 167.94/low at 148.63, which, if broken to the downside, might pave the way for further losses.

If that scenario plays out, the GBP/JPY first support would be the 100-day EMA at 163.07, which, once cleared, will expose the confluence of the 50 and 20-day EMAs, around 162.10/20. A decisive break might send the pair plummeting to the junction of the 200-day EMA and the 61.8% Fibonacci retracement at 160.57.

On the other hand, if GBP/JPY buyers hold the price above 163.81, it could open the door for further gains. The GBP/JPY’s first resistance would be the 164.00 figure, followed by 165, and then the October 5 daily high at 165.71.

GBP/JPY Daily Chart

GBP/JPY Key Technical Levels

GBP/JPY

Overview
Today last price 163.77
Today Daily Change -1.59
Today Daily Change % -0.96
Today daily open 165.38
 
Trends
Daily SMA20 162.33
Daily SMA50 162.32
Daily SMA100 163.03
Daily SMA200 160.56
 
Levels
Previous Daily High 165.54
Previous Daily Low 163.43
Previous Weekly High 162.18
Previous Weekly Low 148.8
Previous Monthly High 167.22
Previous Monthly Low 148.8
Daily Fibonacci 38.2% 164.73
Daily Fibonacci 61.8% 164.24
Daily Pivot Point S1 164.03
Daily Pivot Point S2 162.68
Daily Pivot Point S3 161.92
Daily Pivot Point R1 166.14
Daily Pivot Point R2 166.9
Daily Pivot Point R3 168.25


Share: Feed news

Information on these pages contains forward-looking statements that involve risks and uncertainties. Markets and instruments profiled on this page are for informational purposes only and should not in any way come across as a recommendation to buy or sell in these assets. You should do your own thorough research before making any investment decisions. FXStreet does not in any way guarantee that this information is free from mistakes, errors, or material misstatements. It also does not guarantee that this information is of a timely nature. Investing in Open Markets involves a great deal of risk, including the loss of all or a portion of your investment, as well as emotional distress. All risks, losses and costs associated with investing, including total loss of principal, are your responsibility. The views and opinions expressed in this article are those of the authors and do not necessarily reflect the official policy or position of FXStreet nor its advertisers. The author will not be held responsible for information that is found at the end of links posted on this page.

If not otherwise explicitly mentioned in the body of the article, at the time of writing, the author has no position in any stock mentioned in this article and no business relationship with any company mentioned. The author has not received compensation for writing this article, other than from FXStreet.

FXStreet and the author do not provide personalized recommendations. The author makes no representations as to the accuracy, completeness, or suitability of this information. FXStreet and the author will not be liable for any errors, omissions or any losses, injuries or damages arising from this information and its display or use. Errors and omissions excepted.

The author and FXStreet are not registered investment advisors and nothing in this article is intended to be investment advice.

Recommended content


Recommended content

Editors’ Picks

AUD/USD stays weak below 0.6500 after Australian labor data

AUD/USD stays weak below 0.6500 after Australian labor data

AUD/USD keeps losses below 0.6500 in the Asian session on Thursday, showing little to no reaction to the Australian jobs data for May. Trade uncertainties, escalating geopolitical tensions and the Fed's hawkish pause weigh on investors' sentiment, undermining the risk-sensitive Aussie.

USD/JPY recovers above 145.00 as US Dollar's haven demand strengthens

USD/JPY recovers above 145.00 as US Dollar's haven demand strengthens

USD/JPY is recovering ground above 145.00 in Thursday's Asian trading. The haven demand for the US Dollar gathers strength on likely US attacks on Iran coming this weekend. Hawkish hold by the Fed on Wednesday also supports the Greenback while the Japanese Yen struggles to retain control, despite risk aversion. 

Gold price bounces off weekly low; bulls seem reluctant amid hawkish Fed

Gold price bounces off weekly low; bulls seem reluctant amid hawkish Fed

Gold price attracts some dip-buyers during the Asian session and reverses part of the previous day's slide to the weekly low amid a revival of safe-haven demand, bolstered by trade uncertainties and rising geopolitical tensions. Moreover, a subdued USD price action acts as a tailwind for the bullion.

Bitcoin, Ethereum, XRP hold steady as Federal Reserve leave rates unchanged

Bitcoin, Ethereum, XRP hold steady as Federal Reserve leave rates unchanged

Bitcoin and altcoins, including Ethereum, XRP, and Solana, saw slight movements on Wednesday as the crypto market stayed resilient following the Federal Reserve's decision to leave rates unchanged at 4.25%-4.50%.

In the Eurozone, inflation is also a monetary phenomenon

In the Eurozone, inflation is also a monetary phenomenon

Monetary aggregates continue to be closely monitored by the European Central Bank (ECB), a sign that, despite the passage of time and the increasing complexity of financing circuits, quantitative theory remains relevant. 

The Best brokers to trade EUR/USD

The Best brokers to trade EUR/USD

SPONSORED Discover the top brokers for trading EUR/USD in 2025. Our list features brokers with competitive spreads, fast execution, and powerful platforms. Whether you're a beginner or an expert, find the right partner to navigate the dynamic Forex market.

Forex MAJORS

Cryptocurrencies

Signatures

Best Brokers of 2025