GBP/JPY Price Analysis: Struggles at 164.00, back beneath 163.50
- GBP/JPY is about to finish the week almost flat.
- A multi-month downslope resistance trendline has held the GBP/JPY from re-testing YTD highs.
- GBP/JPY Price Analysis: Failure to crack 164.00 can pave the way for further downside.

The GBP/JPY was rejected around 163.90s, dropping towards the mid 163.00-164.00 range as the Asian Pacific session is about to begin. A risk-off impulse in the FX space spurred a flight to safe-haven peers, like the Japanese Yen (JPY). At the time of typing, the GBP/JPY exchanges hands at 163.30.
GBP/JPY Price Action
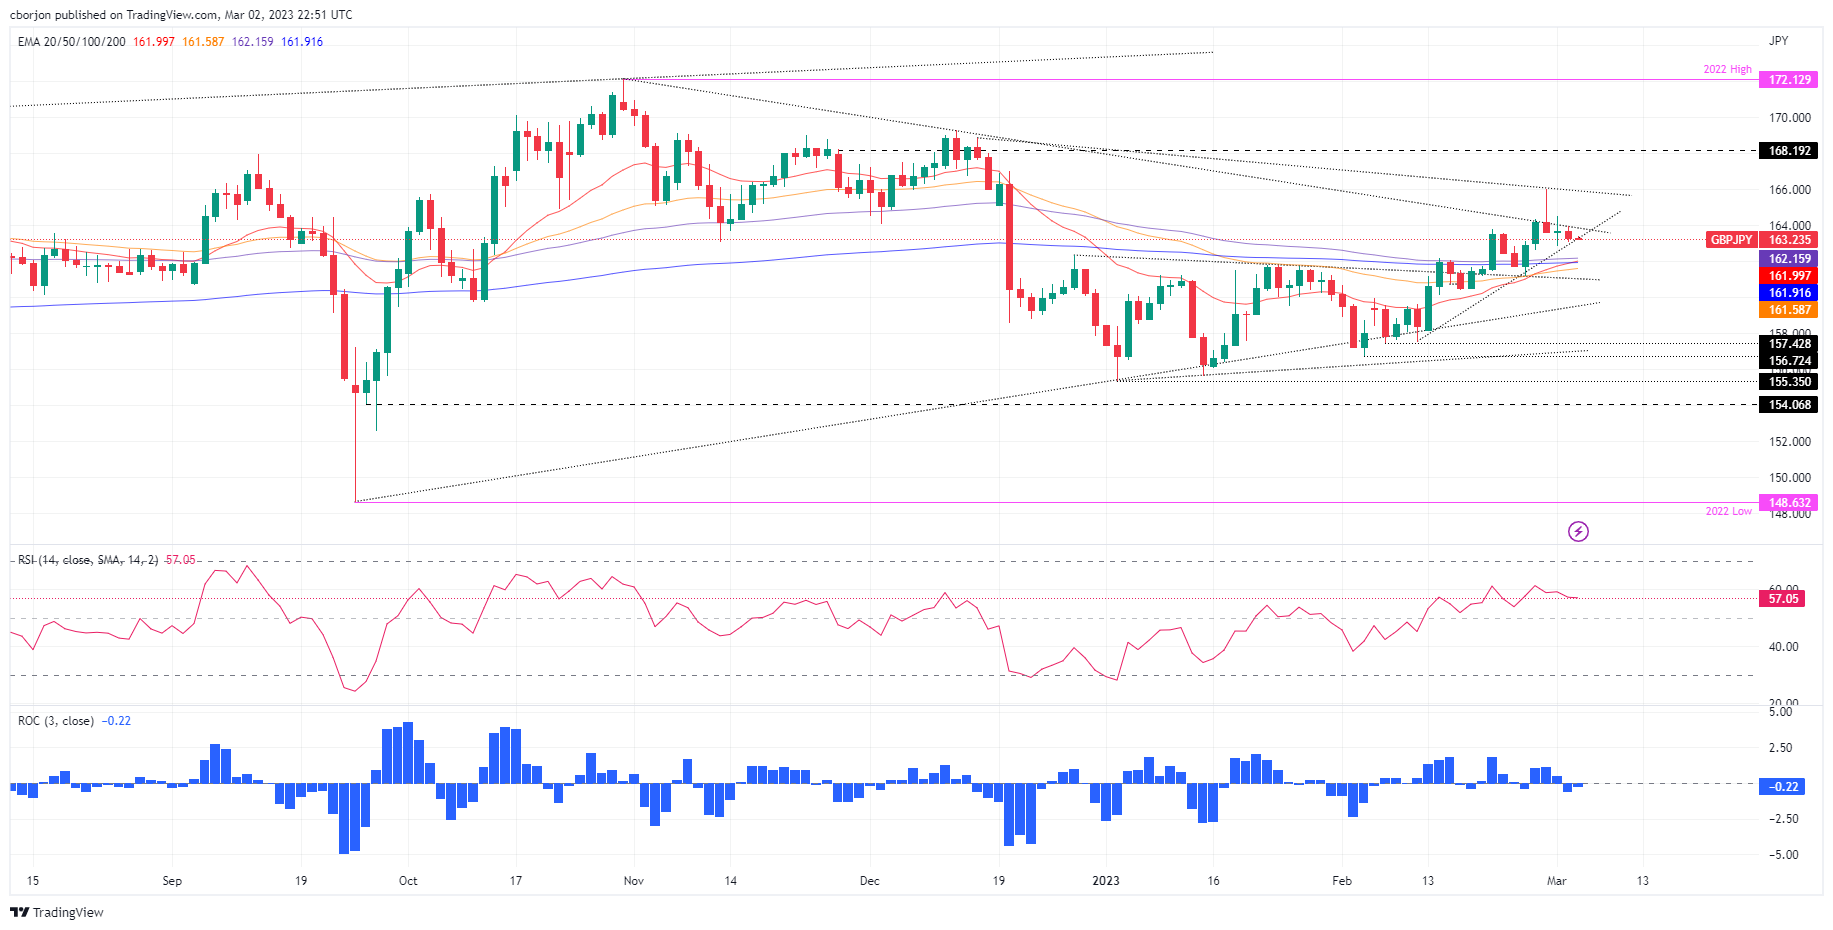
After peaking in the week around 166.00, the GBP/JPY lost traction and extended its losses below 164.00, but the bias is still neutral to upwards. The 20-day Exponential Moving Average (EMA) at 162.00 is aiming north, 16 pips shy of the 100-day EMA. Once cleared, the GBP/JPY could continue to aim higher, but it is facing solid resistance at a five-month-old downslope resistance trendline at around 164.00.
The GBP/JPY needs to crack the trendline for a bullish continuation. Achievement of that, the GBP/JPY next resistance would be the psychological 165.00 figure, followed by the YTD high at 166.00.
Conversely, the GBP/JPY first support would be an upslope trendline drawn from mid-February. A breach of the latter will expose the 100-day Exponential Moving Average (EMA) at 162.16, followed by the 20-day EMA at 162.00.
GBP/JPY Daily chart
GBP/JPY Technical levels
Author

Christian Borjon Valencia
FXStreet
Markets analyst, news editor, and trading instructor with over 14 years of experience across FX, commodities, US equity indices, and global macro markets.


