GBP/JPY Price Analysis: Shifted downwards in the near-term unless bulls reclaim 164.00


  • The GBP/JPY finished the week with decent losses of 0.68%.
  • July’s worldwide reported S&P Global PMIs resurfaced recession concerns in the financial markets, shifting sentiment sour.
  • GBP/JPY Price Analysis: In the short-term downward biased unless buyers reclaim 164.00; otherwise, losses would extend towards 161.80.

The GBP/JPY slides for the third straight day creep below the 50-day EMA at around 163.51, spurred by a dismal market mood, blamed on US companies missing earnings, alongside weak worldwide S&P Global PMIs reigniting recessions worries amongst investors. In the meantime, next week, traders brace for the July US Federal Reserve Open Market Committee (FOMC) monetary policy decision. At the time of writing, the GBP/JPY is trading at 163.22.

GBP/JPY Price Analysis: Technical outlook

The GBP/JPY daily chart depicts the pair as upward biased, despite the ongoing retracement from weekly highs near 166.00, towards the weekly lows at around 163.22. GBP/JPY traders should be aware that the 20 and 50-day EMAs, previous support levels, turned into resistance once the pair nosedived 150 pips. However, the uptrend is still in play unless the GBP/JPY breaks below the July 6 low at 160.38.

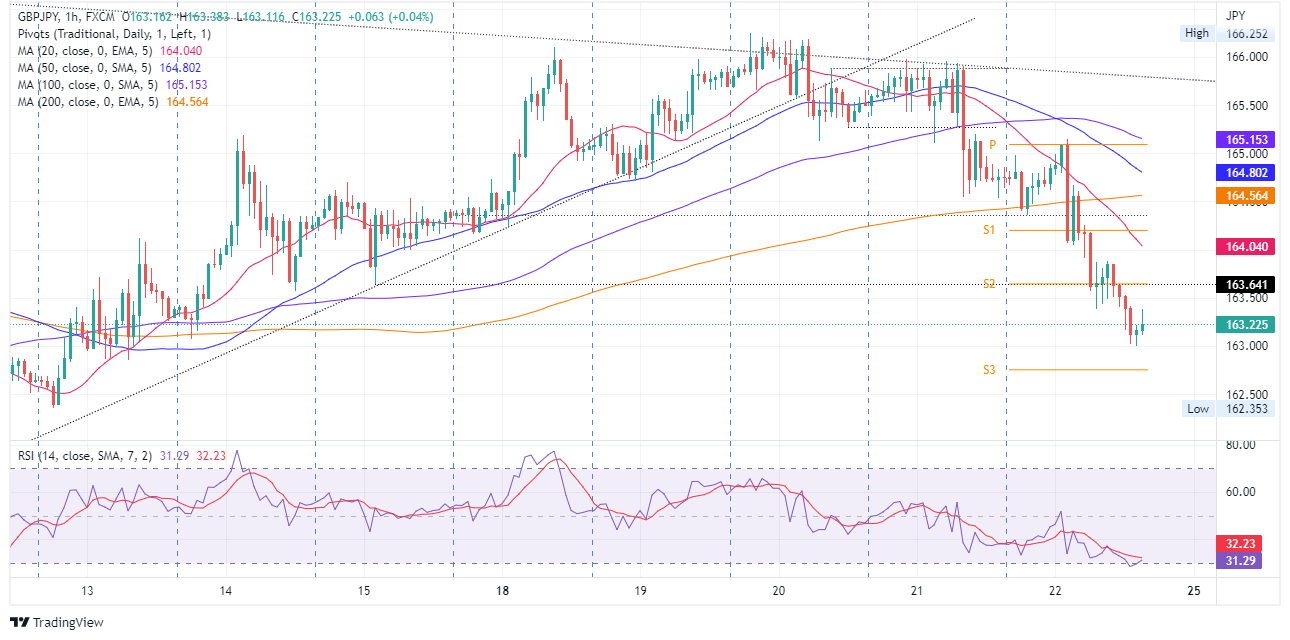
GBP/JPY 1-hour chart

The GBP/JPY hourly chart portrays the cross-currency pair as downward biased. Once the GBP/JPY plunged below the 200-hour EMA around 164.50, it exacerbated a fall towards its weekly lows near 163.00. Late in the session, the GBP/JPY bounced off some 20 pips to current exchange rate levels. Nevertheless, sellers are in charge unless GBP/JPY buyers reclaim 164.00.

Therefore, the GBP/JPY’s first support would be the July 22 low at 163.00. A breach of the latter will expose the S3 daily pivot point at 162.75. Once cleared, the cross next stop would be the confluence of the S4 daily pivot and the July 12 low around the 161.80-85 area.

GBP/JPY Key Technical Levels

GBP/JPY

Overview
Today last price 163.22
Today Daily Change -1.35
Today Daily Change % -0.82
Today daily open 164.64
 
Trends
Daily SMA20 164.37
Daily SMA50 163.48
Daily SMA100 161.86
Daily SMA200 158.14
 
Levels
Previous Daily High 166
Previous Daily Low 164.54
Previous Weekly High 165.2
Previous Weekly Low 161.84
Previous Monthly High 168.74
Previous Monthly Low 160
Daily Fibonacci 38.2% 165.1
Daily Fibonacci 61.8% 165.44
Daily Pivot Point S1 164.12
Daily Pivot Point S2 163.6
Daily Pivot Point S3 162.67
Daily Pivot Point R1 165.58
Daily Pivot Point R2 166.51
Daily Pivot Point R3 167.03


Share: Feed news

Information on these pages contains forward-looking statements that involve risks and uncertainties. Markets and instruments profiled on this page are for informational purposes only and should not in any way come across as a recommendation to buy or sell in these assets. You should do your own thorough research before making any investment decisions. FXStreet does not in any way guarantee that this information is free from mistakes, errors, or material misstatements. It also does not guarantee that this information is of a timely nature. Investing in Open Markets involves a great deal of risk, including the loss of all or a portion of your investment, as well as emotional distress. All risks, losses and costs associated with investing, including total loss of principal, are your responsibility. The views and opinions expressed in this article are those of the authors and do not necessarily reflect the official policy or position of FXStreet nor its advertisers. The author will not be held responsible for information that is found at the end of links posted on this page.

If not otherwise explicitly mentioned in the body of the article, at the time of writing, the author has no position in any stock mentioned in this article and no business relationship with any company mentioned. The author has not received compensation for writing this article, other than from FXStreet.

FXStreet and the author do not provide personalized recommendations. The author makes no representations as to the accuracy, completeness, or suitability of this information. FXStreet and the author will not be liable for any errors, omissions or any losses, injuries or damages arising from this information and its display or use. Errors and omissions excepted.

The author and FXStreet are not registered investment advisors and nothing in this article is intended to be investment advice.

Recommended content


Recommended content

Editors’ Picks

AUD/USD failed just ahead of the 200-day SMA

AUD/USD failed just ahead of the 200-day SMA

Finally, AUD/USD managed to break above the 0.6500 barrier on Wednesday, extending the weekly recovery, although its advance faltered just ahead of the 0.6530 region, where the key 200-day SMA sits.

AUD/USD News

EUR/USD met some decent resistance above 1.0700

EUR/USD met some decent resistance above 1.0700

EUR/USD remained unable to gather extra upside traction and surpass the 1.0700 hurdle in a convincing fashion on Wednesday, instead giving away part of the weekly gains against the backdrop of a decent bounce in the Dollar.

EUR/USD News

Gold stays firm amid higher US yields as traders await US GDP data

Gold stays firm amid higher US yields as traders await US GDP data

Gold recovers from recent losses, buoyed by market interest despite a stronger US Dollar and higher US Treasury yields. De-escalation of Middle East tensions contributed to increased market stability, denting the appetite for Gold buying.

Gold News

Ethereum suffers slight pullback, Hong Kong spot ETH ETFs to begin trading on April 30

Ethereum suffers slight pullback, Hong Kong spot ETH ETFs to begin trading on April 30

Ethereum suffered a brief decline on Wednesday afternoon despite increased accumulation from whales. This follows Ethereum restaking protocol Renzo restaked ETH crashing from its 1:1 peg with ETH and increased activities surrounding spot Ethereum ETFs.

Read more

Dow Jones Industrial Average hesitates on Wednesday as markets wait for key US data

Dow Jones Industrial Average hesitates on Wednesday as markets wait for key US data

The DJIA stumbled on Wednesday, falling from recent highs near 38,550.00 as investors ease off of Tuesday’s risk appetite. The index recovered as US data continues to vex financial markets that remain overwhelmingly focused on rate cuts from the US Fed.

Read more

Forex MAJORS

Cryptocurrencies

Signatures