|

GBP/JPY Price Analysis: Renews weekly low past 183.00 on rising wedge confirmation, ignores strong yields

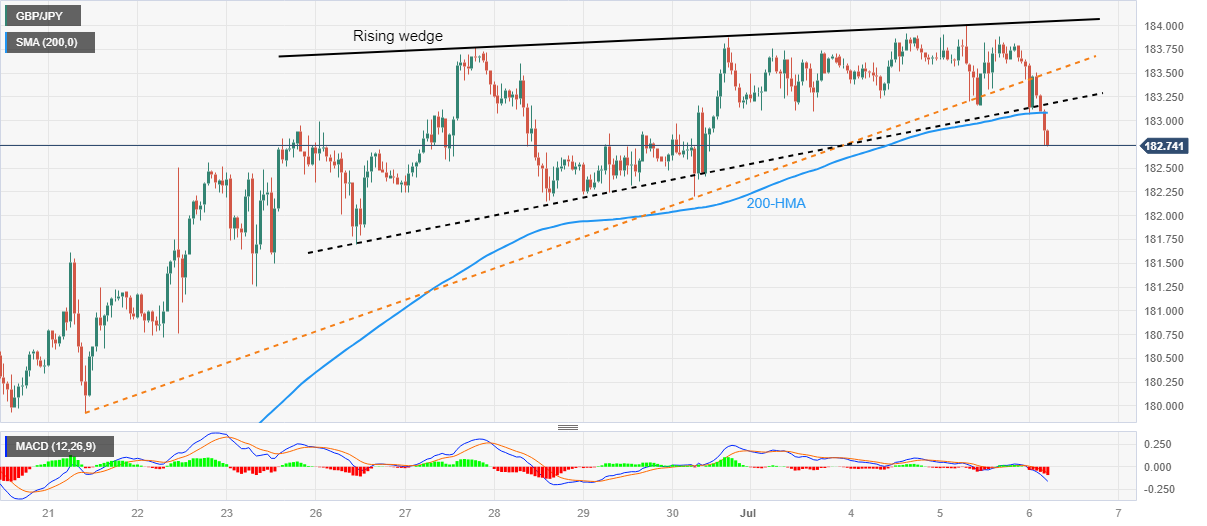
  • GBP/JPY eyes the biggest daily loss in a week after confirming bearish chart formation, pressured around intraday low of late.
  • US 10-year, two-year Treasury bond yields refresh three-month high amid hawkish Fed bets, recession woes.
  • Theoretical target of 180.90 can prod GBP/JPY bears on their way to 180.00 psychological magnet.
  • Bulls have a long road to travel before retaking control, 184.00 is the key.

GBP/JPY takes offers to refresh the weekly low around 182.70 heading into Thursday’s London open. The cross-currency pair's latest weakness could be linked to the market's risk-off mood. However, the firmer yields should have prod the quote of late.

Also read: Asian stocks drop as S&P500 Futures slide to 4,470, US Treasury bond yields refresh three-month high

In doing so, the cross-currency pair justifies the previous day’s confirmation of the one-week-old rising wedge bearish chart pattern. Additionally favoring the pair sellers is the quote’s sustained break of the 200-Hour Moving Average (HMA), as well as the bearish MACD signals.

That said, the GBP/JPY becomes vulnerable to testing the rising wedge’s theoretical target of around 180.90. However, the late June swing high near 181.50 and the 180.00 round figure are extra filters toward the south that gain the market’s attention.

Meanwhile, the June 20 swing low of around 179.90 appears the last defense of the short-term GBP/JPY buyers.

On the flip side, 200-HMA and the bottom line of the aforementioned wedge limit short-term recovery of the GBP/JPY pair around 183.10 and 183.20 in that order.

Following that, an upward-sloping support line from June 21 and the stated wedge’s top line, respectively near 183.50 and 184.05, can challenge the GBP/JPY buyers before giving them control.

GBP/JPY: Hourly chart

Trend: Further weakness expected

Additional important levels

Overview
Today last price182.81
Today Daily Change-0.97
Today Daily Change %-0.53%
Today daily open183.78
 
Trends
Daily SMA20180.7
Daily SMA50175.21
Daily SMA100169.4
Daily SMA200166.5
 
Levels
Previous Daily High184.02
Previous Daily Low183.16
Previous Weekly High183.88
Previous Weekly Low181.69
Previous Monthly High183.88
Previous Monthly Low172.67
Daily Fibonacci 38.2%183.69
Daily Fibonacci 61.8%183.48
Daily Pivot Point S1183.29
Daily Pivot Point S2182.79
Daily Pivot Point S3182.43
Daily Pivot Point R1184.15
Daily Pivot Point R2184.51
Daily Pivot Point R3185.01

Author

Anil Panchal

Anil Panchal

FXStreet

Anil Panchal has nearly 15 years of experience in tracking financial markets. With a keen interest in macroeconomics, Anil aptly tracks global news/updates and stays well-informed about the global financial moves and their implications.

More from Anil Panchal
Share:

Markets move fast. We move first.

Orange Juice Newsletter brings you expert driven insights - not headlines. Every day on your inbox.

By subscribing you agree to our Terms and conditions.

Editor's Picks

EUR/USD bounces toward 1.1750 as US Dollar loses strength

EUR/USD returned to the 1.1750 price zone in the American session on Friday, despite falling Wall Street, which indicates risk aversion. Trading conditions remain thin following the New Year holiday and ahead of the weekend, with the focus shifting to US employment and European data scheduled for next week.

GBP/USD nears 1.3500, holds within familiar levels

After testing 1.3400 on the last day of 2025, GBP/USD managed to stage a rebound. Nevertheless, the pair finds it difficult to gather momentum and trades with modest intraday gains at around 1.3490 as market participants remain in holiday mood.

Gold trims intraday gains, approaches $4,300

Gold retreated sharply from the $4,400  area and trades flat for the day in the $4,320 price zone. Choppy trading conditions exacerbated the intraday decline, although XAU/USD bearish case is out of the picture, considering growing expectations for a dovish Fed and persistent geopolitical tensions.

Cardano gains early New Year momentum, bulls target falling wedge breakout

Cardano kicks off the New Year on a positive note and is extending gains, trading above $0.36 at the time of writing on Friday. Improving on-chain and derivatives data point to growing bullish interest, while the technical outlook keeps an upside breakout in focus.

Economic outlook 2026-2027 in advanced countries: Solidity test

After a year marked by global economic resilience and ending on a note of optimism, 2026 looks promising and could be a year of solid economic performance. In our baseline scenario, we expect most of the supportive factors at work in 2025 to continue to play a role in 2026.

Crypto market outlook for 2026

Year 2025 was volatile, as crypto often is.  Among positive catalysts were favourable regulatory changes in the U.S., rise of Digital Asset Treasuries (DAT), adoption of AI and tokenization of Real-World-Assets (RWA).