GBP/JPY Price Analysis: Hits YTD highs on risk-on sentiment, retraces as a rising wedge forms


Share:
  • GBP/JPY surges to year's high, up by 0.18%, amid positive market sentiment.
  • Expectations of a dovish Fed and resolution of the US debt-ceiling imbue strength to high beta currencies.
  • Despite the overall upward bias, the technical outlook suggests potential downside pressure on GBP/JPY.

GBP/JPY climbed to fresh year-to-date (YTD) highs at 174.68 before a pullback that dragged the exchange rate toward the 174.10s area. A risk-on impulse caused expectations for a dovish US Federal Reserve (Fed) amongst geopolitical issues like the US debt-ceiling resolution underpinned high beta currencies. Therefore, safe-haven peers persisted pressured, as the GBP/JPY traded at 174.12, up 0.18%.

GBP/JPY Price Analysis: Technical outlook

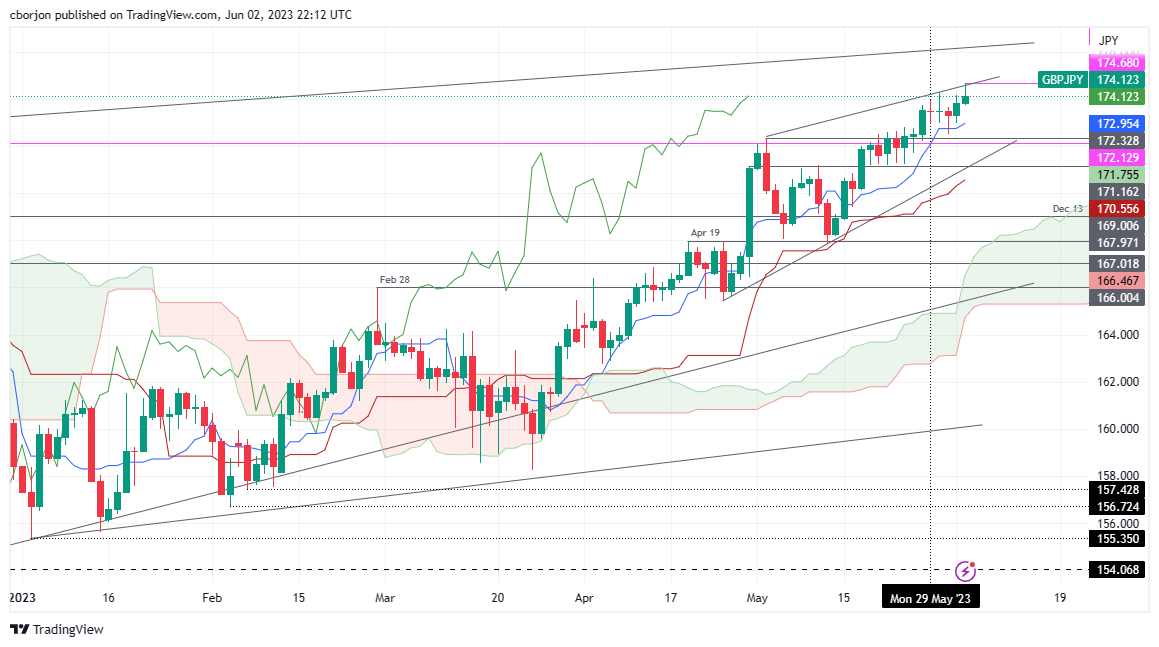
The GBP/JPY is still upward biased, confirmed by price action widening its distance from the Tenkan-Sen and Kijun-Sen lines below the exchange rate. In addition, price action is another bullish signal above the Ichimoku cloud.

Nevertheless, an upslope resistance trendline from the May 2 highs cushioned the GBP/JPY rally; while a support trendline, drawn from the April and May lows, indicates a rising wedge forming. That means further downside pressure is expected.

If GBP/JPY falls below the 174.00 figure, the next support would be the Tenkan-Sen at 172.95. A breach of the latter will expose the 2022 high turned support at 172.13 before testing April 28 daily high at 171.16. Conversely, the uptrend would continue above the YTD high at 174.68 once cleared, and the GBP/JPY could rally to the 175.00 mark, followed by the 2016 high at 177.37.

GBP/JPY Price Action – Daily chart

GBP/JPY Daily chart

GBP/JPY

Overview
Today last price 174.27
Today Daily Change 0.42
Today Daily Change % 0.24
Today daily open 173.85
 
Trends
Daily SMA20 171.61
Daily SMA50 168.22
Daily SMA100 164.6
Daily SMA200 164.42
 
Levels
Previous Daily High 174.19
Previous Daily Low 172.97
Previous Weekly High 173.74
Previous Weekly Low 171.2
Previous Monthly High 174.28
Previous Monthly Low 167.84
Daily Fibonacci 38.2% 173.73
Daily Fibonacci 61.8% 173.44
Daily Pivot Point S1 173.15
Daily Pivot Point S2 172.45
Daily Pivot Point S3 171.93
Daily Pivot Point R1 174.37
Daily Pivot Point R2 174.89
Daily Pivot Point R3 175.59


Share: Feed news

Information on these pages contains forward-looking statements that involve risks and uncertainties. Markets and instruments profiled on this page are for informational purposes only and should not in any way come across as a recommendation to buy or sell in these assets. You should do your own thorough research before making any investment decisions. FXStreet does not in any way guarantee that this information is free from mistakes, errors, or material misstatements. It also does not guarantee that this information is of a timely nature. Investing in Open Markets involves a great deal of risk, including the loss of all or a portion of your investment, as well as emotional distress. All risks, losses and costs associated with investing, including total loss of principal, are your responsibility. The views and opinions expressed in this article are those of the authors and do not necessarily reflect the official policy or position of FXStreet nor its advertisers. The author will not be held responsible for information that is found at the end of links posted on this page.

If not otherwise explicitly mentioned in the body of the article, at the time of writing, the author has no position in any stock mentioned in this article and no business relationship with any company mentioned. The author has not received compensation for writing this article, other than from FXStreet.

FXStreet and the author do not provide personalized recommendations. The author makes no representations as to the accuracy, completeness, or suitability of this information. FXStreet and the author will not be liable for any errors, omissions or any losses, injuries or damages arising from this information and its display or use. Errors and omissions excepted.

The author and FXStreet are not registered investment advisors and nothing in this article is intended to be investment advice.

Follow us on Telegram

Stay updated of all the news

Join Telegram

Recommended content


Follow us on Telegram

Stay updated of all the news

Join Telegram

Recommended content

Editors’ Picks

EUR/USD hits fresh daily lows under 1.0500

EUR/USD hits fresh daily lows under 1.0500

EUR/USD continued to face downward pressure and matched last week's low at 1.0487. It is hovering around 1.0500, as the US Dollar remains strong, supported by higher Treasury yields. The 10-year Treasury yield reached 4.70%, a level not seen since 2007.

EUR/USD News

GBP/USD drops to six-month lows, eyes 1.2100

GBP/USD drops to six-month lows, eyes 1.2100

GBP/USD retreated further and dropped to 1.2107, hitting the lowest since mid-April. The pair remains under pressure amid higher US Treasury yields, following better-than-expected ISM September Manufacturing PMI data.

GBP/USD News

Gold approaches $1,800 as demand for the USD prevails Premium

Gold approaches $1,800 as demand for the USD prevails

Spot Gold fell to a fresh multi-month low of $1,827.11 a troy ounce on Monday amid resurgent  US Dollar demand. The Greenback suffered a minor setback at the beginning of the week, as generally encouraging Chinese data and upbeat United States (US) news underpinned the mood.

Gold News

Three altcoins that have kickstarted Q4 rally: LINK, RDNT, FLOKI

Three altcoins that have kickstarted Q4 rally: LINK, RDNT, FLOKI

Crypto market volatility seems to be making a comeback with the start of 2023’s fourth quarter , and some altcoins are already making headway. Chainlink (LINK), Radiant Capital (RDNT) and Floki Inu (FLOKI) are some cryptos that are showing aggressive upside moves. 

Read more

NIO contracts 2% as Tesla delivery decline weighs on EV sector

NIO contracts 2% as Tesla delivery decline weighs on EV sector

Nio (NIO) stock dropped 2.3% on Monday morning despite meeting its quarterly delivery target for the third quarter. Tesla's (TSLA) Q3 production and delivery decline is the culprit.

Read more

Forex MAJORS

Cryptocurrencies

Signatures