|

GBP/JPY Price Analysis: Experiences a pullback as double top looms

  • GBP/JPY witnesses a decline of over 0.20%, with the Japanese Yen gaining strength against major currencies.
  • Despite the pair's overall bullish trend, recent price actions have formed a 'double top' pattern, thought further confirmation needed, with prices breaking below 184.46.
  • Conversely, a move above the November 28 daily high of 187.87 could set the stage for the pair to test the year-to-date high at 188.80.

The GBP/JPY retreats on Tuesday by more than 0.20%, as the Japanese Yen (JPY) appreciated further against most G8 FX currencies. Market participants estimate that central banks in developed countries would cut rates, boosting the appetite for the Yen's safe-haven status and Gold. Therefore, the pair is trading at 187.24 after hitting a daily high of 187.87.

Even though the GBP/JPY remains bullish, price action during the last couple of days, has formed a ‘double top’ chart pattern, implying that lower prices are coming. Nevertheless to confirm the pattern, the cross must drop below the November 21 swing low at 184.46, but sellers must breach support levels on its way to the latter.

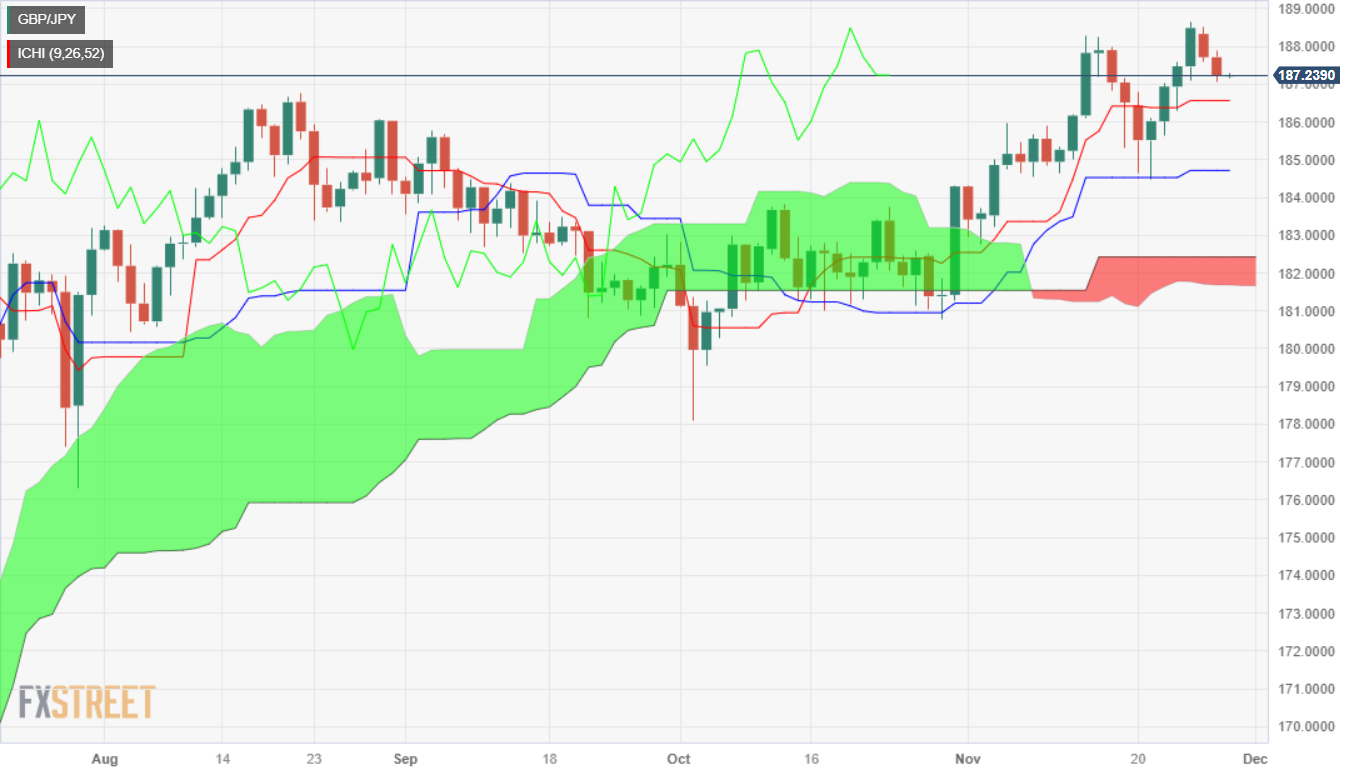
The first support would be the Tenkan-Sen at 186.55, followed by the Senkou-Span A at 185.63. A decisive break, the pair would dive to the Kijun-Sen at 184.71, before testing the latest cycle low. Once done, the ‘double top’ chart pattern targets the 180.50 area.

On the flip side, if GBP/JPY buyers reclaim the November 28 daily high at 187.87, that could open the door to challenge the year-to-date (YTD) high at 188.80.

GBP/JPY Price Analysis – Daily Chart

GBP/JPY Technical Levels

GBP/JPY

Overview
Today last price187.21
Today Daily Change-0.50
Today Daily Change %-0.27
Today daily open187.71
 
Trends
Daily SMA20185.98
Daily SMA50183.61
Daily SMA100183.39
Daily SMA200176.72
 
Levels
Previous Daily High188.53
Previous Daily Low187.61
Previous Weekly High188.67
Previous Weekly Low184.47
Previous Monthly High184.33
Previous Monthly Low178.08
Daily Fibonacci 38.2%187.96
Daily Fibonacci 61.8%188.18
Daily Pivot Point S1187.37
Daily Pivot Point S2187.03
Daily Pivot Point S3186.45
Daily Pivot Point R1188.29
Daily Pivot Point R2188.87
Daily Pivot Point R3189.21

Author

Christian Borjon Valencia

Markets analyst, news editor, and trading instructor with over 14 years of experience across FX, commodities, US equity indices, and global macro markets.

More from Christian Borjon Valencia
Share:

Editor's Picks

EUR/USD stays defensive below 1.1900 as USD recovers

EUR/USD trades in negative territory for the third consecutive day, below 1.1900 in the European session on Thursday. A modest rebound in the US Dollar is weighing on the pair, despite an upbeat market mood. Traders keep an eye on the US weekly Initial Jobless Claims data for further trading impetus. 

GBP/USD holds above 1.3600 after UK data dump

\GBP/USD moves little while holding above 1.3600 in the European session on Thursday, following the release of the UK Q4 preliminary GDP, which showed a 0.1% growth against a 0.2% increase expected. The UK industrial sector activity deteriorated in Decembert, keeping the downward pressure intact on the Pound Sterling. 

Gold sticks to modest intraday losses as reduced March Fed rate cut bets underpin USD

Gold languishes near the lower end of its daily range heading into the European session on Thursday. The precious metal, however, lacks follow-through selling amid mixed cues and currently trades above the $5,050 level, well within striking distance of a nearly two-week low touched the previous day.

Cardano eyes short-term rebound as derivatives sentiment improves

Cardano (ADA) is trading at $0.257 at the time of writing on Thursday, after slipping more than 4% so far this week. Derivatives sentiment improves as ADA’s funding rates turn positive alongside rising long bets among traders.

The market trades the path not the past

The payroll number did not just beat. It reset the tone. 130,000 vs. 65,000 expected, with a 35,000 whisper. 79 of 80 economists leaning the wrong way. Unemployment and underemployment are edging lower. For all the statistical fog around birth-death adjustments and seasonal quirks, the core message was unmistakable. The labour market is not cracking.

Sonic Labs’ vertical integration fuels recovery in S token

Sonic, previously Fantom (FTM), is extending its recovery trade at $0.048 at the time of writing, after rebounding by over 12% the previous day. The recovery thesis’ strengths lie in the optimism surrounding Sonic Labs’ Wednesday announcement to shift to a vertically integrated model, aimed at boosting S token utility.