GBP/JPY Price Analysis: Eases below 200-SMA inside rising wedge
- GBP/JPY fades bounce from support line of two-week-old bearish chart pattern.
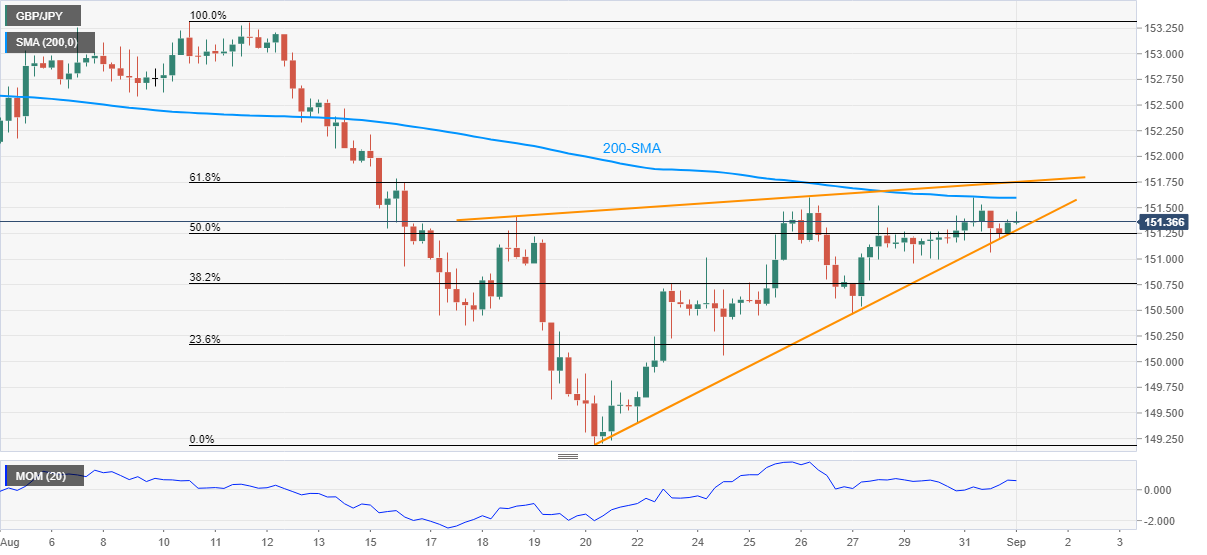
- Upbeat momentum line challenge sellers, 151.75 becomes the key hurdle to the north.
- Clear break of 151.30 could reverse recovery moves from late August.

GBP/JPY teases bears around 151.30 during early Wednesday. Even if the cross-currency pair defends the support line of a short-term bearish formation, a sustained trading below 200-SMA keeps sellers hopeful.
However, a clear downside break of 151.30 becomes necessary for the bearish pattern’s confirmation, which in turn will direct sellers toward the previous month’s low near 149.20.
During the fall, the 150.00 threshold may entertain sellers, lows marked during late March and July, around 148.50-45, which could challenge the GBP/JPY downside.
Alternatively, the 200-SMA level of 151.60 restricts intraday buyer’s entry ahead of the key 151.75 resistance confluence, comprising 61.8% Fibonacci retracement level of August 10–20 downside and the resistance line of the stated wedge.
If at all the GBP/JPY prices successfully cross the 151.75 hurdle, bulls can aim for early August lows near 152.60 before targeting the previous month’s high near 153.30.
GBP/JPY: Four-hour chart
Trend: Further weakness expected
Author

Anil Panchal
FXStreet
Anil Panchal has nearly 15 years of experience in tracking financial markets. With a keen interest in macroeconomics, Anil aptly tracks global news/updates and stays well-informed about the global financial moves and their implications.


