|

GBP/JPY Price Analysis: Drops back below 200-EMA within key bullish channel

  • GBP/JPY prints mild losses while reversing the previous day’s bounce off one-month low.
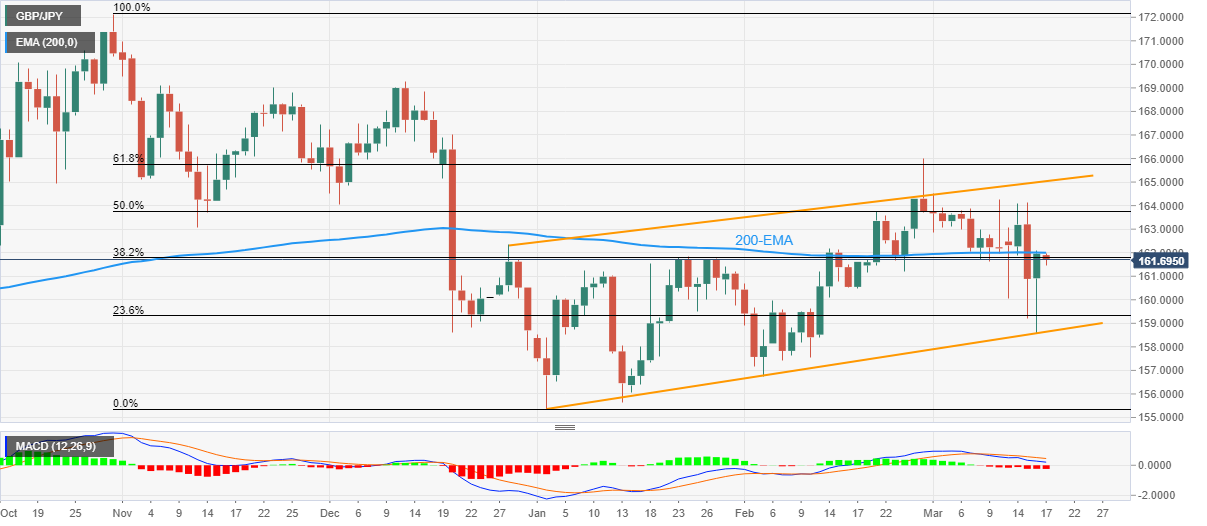
  • Bearish MACD signals, repeated failures to cross 200-EMA keep sellers hopeful.
  • 11-week-old ascending trend channel restricts short-term downside, suggests gradual run-up to refresh YTD top.

GBP/JPY consolidates the biggest daily gain in two weeks around 161.60, down 0.30% intraday, during early Friday. In doing so, the cross-currency pair braces for the second consecutive weekly loss while staying inside an upward-sloping trend channel stretched from late December 2022.

That said, the aforementioned bullish channel’s lower line triggered the quote’s rebound the previous day. However, the 200-day Exponential Moving Average (EMA), at 162.00 by the press time, challenged the GBP/JPY upside and paved the way for the pair’s latest fall.

In addition to the failure to cross the 200-EMA, the bearish MACD signals also favor the GBP/JPY sellers to aim for the 160.00 psychological magnet. Though, the stated channel’s bottom line, close to 158.65 by the press time, could challenge the pair bears afterward.

In a case where the cross-currency pair drops below 158.65, the odds of witnessing a south-run targeting the Year-To-Date (YTD) low of near 155.35 can’t be ruled out.

On the contrary, an upside break of the 200-EMA hurdle surrounding 162.00 could trigger a rally targeting the 50% Fibonacci retracement level of the pair’s moves between October 2022 and January 2023, around 163.80 as we write.

It’s worth noting, however, that the bullish channel’s top line surrounding 165.00 could challenge GBP/JPY bulls past 163.80, a break of which could quickly refresh 2023 peak, near 166.00 at the latest.

GBP/JPY: Daily chart

Trend: Gradual upside expected

Additional important levels

Overview
Today last price161.67
Today Daily Change-0.29
Today Daily Change %-0.18%
Today daily open161.96
 
Trends
Daily SMA20162.68
Daily SMA50160.86
Daily SMA100163
Daily SMA200163.34
 
Levels
Previous Daily High162.11
Previous Daily Low158.57
Previous Weekly High164.26
Previous Weekly Low161.62
Previous Monthly High166.01
Previous Monthly Low156.73
Daily Fibonacci 38.2%160.76
Daily Fibonacci 61.8%159.92
Daily Pivot Point S1159.65
Daily Pivot Point S2157.34
Daily Pivot Point S3156.1
Daily Pivot Point R1163.19
Daily Pivot Point R2164.42
Daily Pivot Point R3166.73

Author

Anil Panchal

Anil Panchal

FXStreet

Anil Panchal has nearly 15 years of experience in tracking financial markets. With a keen interest in macroeconomics, Anil aptly tracks global news/updates and stays well-informed about the global financial moves and their implications.

More from Anil Panchal
Share:

Markets move fast. We move first.

Orange Juice Newsletter brings you expert driven insights - not headlines. Every day on your inbox.

By subscribing you agree to our Terms and conditions.

Editor's Picks

EUR/USD moves sideways below 1.1800 on Christmas Eve

EUR/USD struggles to find direction and trades in a narrow channel below 1.1800 after posting gains for two consecutive days. Bond and stock markets in the US will open at the usual time and close early on Christmas Eve, allowing the trading action to remain subdued. 

GBP/USD keeps range around 1.3500 amid quiet markets

GBP/USD keeps its range trade intact at around 1.3500 on Wednesday. The Pound Sterling holds the upper hand over the US Dollar amid pre-Christmas light trading as traders move to the sidelines heading into the holiday season. 

Gold retreats from record highs, trades below $4,500

Gold retreats after setting a new record-high above $4,520 earlier in the day and trades in a tight range below $4,500 as trading volumes thin out ahead of the Christmas break. The US Dollar selling bias remains unabated on the back of dovish Fed expectations, which continues to act as a tailwind for the bullion amid persistent geopolitical risks.

Bitcoin slips below $87,000 as ETF outflows intensify, whale participation declines

Bitcoin price continues to trade around $86,770 on Wednesday, after failing to break above the $90,000 resistance. US-listed spot ETFs record an outflow of $188.64 million on Tuesday, marking the fourth consecutive day of withdrawals.

Economic outlook 2026-2027 in advanced countries: Solidity test

After a year marked by global economic resilience and ending on a note of optimism, 2026 looks promising and could be a year of solid economic performance. In our baseline scenario, we expect most of the supportive factors at work in 2025 to continue to play a role in 2026.

Avalanche struggles near $12 as Grayscale files updated form for ETF

Avalanche trades close to $12 by press time on Wednesday, extending the nearly 2% drop from the previous day. Grayscale filed an updated form to convert its Avalanche-focused Trust into an ETF with the US Securities and Exchange Commission.