|

GBP/JPY Price Analysis: Could negative divergence between RSI and price action trigger a correction?

  • GBP/JPY struggles to break the 184.00 mark amid potential Japanese FX intervention, ending Tuesday with near flatline movement.
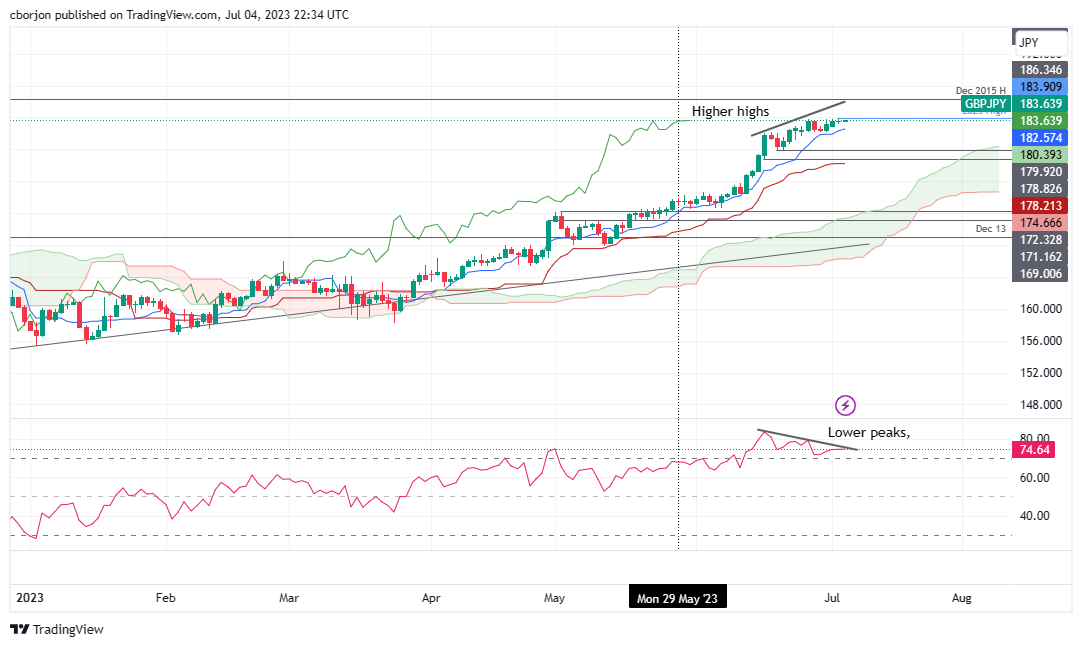
  • Negative divergence in RSI suggests a potential for a pullback, with the Tenkan-Sen line inching closer to price action.
  • Key levels to watch include resistance at 186.34 and several support levels leading down to the Kijun-Sen line at 178.21.

GBP/JPY consolidates at around the 183.60s area after hitting a year-to-date (YTD) high of 183.90, shy of hitting the 184.00 mark. On Tuesday, the GBP/JPY finished the session around 183.59, nearby its open price, forming a doji. That said, GBP/JPY is set to trade sideways unless a catalyst spurs a break to eigh-year highs or a correction gets underway. As the Asian session commences, the GBP/JPY trades at 153.65, almost flat.

GBP/JPY Price Analysis: Technical outlook

The GBP/JPY remains upward biased, though of late, the pair has struggled to get to new YTD highs, as threats of Japan’s government intervention in the FX markets keep traders on their toes. The Relative Strength Index (RSI) indicator remains at overbought levels, printing lower peaks, while the GBP/JPY registers higher highs. That means a negative divergence surfaced, which could pave the way for a pullback.

Additionally, the Tenkan-Sen line is getting close to price action, opening the door for a fall below the latte, which could spur a GBP/JPY sell signal, opening the door for a pullback toward the Senkou Span A line at 180.39 before slumping toward the June 20 daily low of 179.92. Break below will expose a test of the June 16 low of 178.82, slightly above the Kijun-Sen line at 178.21.

Conversely, if the GBP/JPY cracks the 184.00 mark, the first resistance appears at December’s 2015 high of 186.34, followed by the 190.00 figure.

GBP/JPY Price Action – Daily chart

GBP/JPY Daily chart

GBP/JPY

Overview
Today last price183.62
Today Daily Change0.01
Today Daily Change %0.01
Today daily open183.61
 
Trends
Daily SMA20179.72
Daily SMA50174.51
Daily SMA100168.96
Daily SMA200166.23
 
Levels
Previous Daily High183.76
Previous Daily Low183.1
Previous Weekly High183.88
Previous Weekly Low181.69
Previous Monthly High183.88
Previous Monthly Low172.67
Daily Fibonacci 38.2%183.51
Daily Fibonacci 61.8%183.35
Daily Pivot Point S1183.22
Daily Pivot Point S2182.83
Daily Pivot Point S3182.56
Daily Pivot Point R1183.88
Daily Pivot Point R2184.15
Daily Pivot Point R3184.54
 

Author

Christian Borjon Valencia

Christian Borjon began his career as a retail trader in 2010, mainly focused on technical analysis and strategies around it. He started as a swing trader, as he used to work in another industry unrelated to the financial markets.

More from Christian Borjon Valencia
Share:

Markets move fast. We move first.

Orange Juice Newsletter brings you expert driven insights - not headlines. Every day on your inbox.

By subscribing you agree to our Terms and conditions.

Editor's Picks

EUR/USD climbs toward 1.1800 on broad USD weakness

EUR/USD gathers bullish momentum and advances toward 1.1800 in the second half of the day on Tuesday. The US Dollar weakens and helps the pair stretch higher after the employment report showed that Nonfarm Payrolls declined by 105,000 in October before rising by 64,000 in November.

GBP/USD climbs to fresh two-month high above 1.3400

GBP/USD gains traction in the American session and trades at its highest level since mid-October above 1.3430. The British Pound benefits from upbeat PMI data, while the US Dollar struggles to find demand following the mixed employment figures and weaker-than-forecast PMI prints, allowing the pair to march north.

Gold extends its consolidative phase around $4,300

Gold trades in positive above $4,300 after spending the first half of the day under bearish pressure. XAU/USD capitalizes on renewed USD weakness after the jobs report showed that the Unemployment Rate climbed to 4.6% in November and the PMI data revealed a loss of growth momentum in the private sector in December. 

US Retail Sales virtually unchanged at $732.6 billion in October

Retail Sales in the United States were virtually unchanged at $732.6 billion in October, the US Census Bureau reported on Tuesday. This print followed the 0.1% increase (revised from 0.3%) recorded in September and came in below the market expectation of +0.1%.

Ukraine-Russia in the spotlight once again

Since the start of the week, gold’s price has moved lower, but has yet to erase the gains made last week. In today’s report we intend to focus on the newest round of peace talks between Russia and Ukraine, whilst noting the release of the US Employment data later on day and end our report with an update in regards to the tensions brewing in Venezuela.

BNB Price Forecast: BNB slips below $855 as bearish on-chain signals and momentum indicators turn negative

BNB, formerly known as Binance Coin, continues to trade down around $855 at the time of writing on Tuesday, after a slight decline the previous day. Bearish sentiment further strengthens as BNB’s on-chain and derivatives data show rising retail activity.