GBP/JPY Price Analysis: Bears attack 100-SMA support near 160.00


  • GBP/JPY holds lower ground near 100-SMA support, down for the second consecutive day.
  • Downbeat MACD signals, RSI (14) add strength to the bearish bias.
  • Five-week-old descending resistance line holds the key to buyer’s conviction.

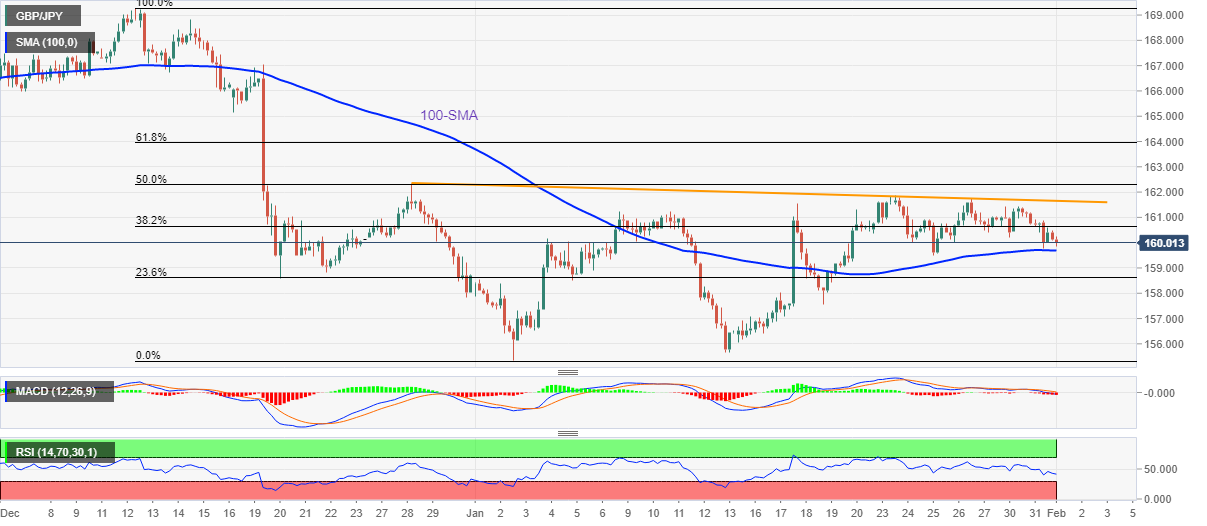
GBP/JPY fades the late Tuesday’s corrective bounce off the 100-bar Simple Moving Average (SMA) as it prints mild losses near the 160.00 psychological magnet during early Wednesday. In doing so, the cross-currency pair keeps the previous week’s retreat from a one-month high.

Not only the failure to defend the bounce off 100-SMA but bearish MACD signals and downbeat RSI (14), not oversold, also keeps GBP/JPY bears hopeful.

However, a clear downside break of the stated SMA level surrounding 159.70 becomes necessary for the GBP/JPY bears.

Following that, the January 19 swing low near 157.60 could act as a buffer during the fall targeting the previous monthly low of 155.36. It should be noted that May 2022 low near 155.60 also challenges the short-term GBP/JPY bears.

Meanwhile, recovery moves may aim for the latest peak surrounding 161.45 before approaching a downward-sloping resistance line from late December 2022, close to 161.65 at the latest.

In a case where the quote rises past 161.65, the 50% Fibonacci retracement of GBP/JPY downbeat between late 2022 and early January 2023, around 162.30, could act as the last defense of the bears.

To sum up, GBP/JPY is likely to remain bearish even if the 100-SMA challenges the immediate downside.

GBP/JPY: Four-hour chart

Trend: Further downside expected

Additional important levels

Overview
Today last price 159.98
Today Daily Change -0.46
Today Daily Change % -0.29%
Today daily open 160.44
 
Trends
Daily SMA20 159.76
Daily SMA50 162.47
Daily SMA100 163.73
Daily SMA200 163.37
 
Levels
Previous Daily High 161.2
Previous Daily Low 159.77
Previous Weekly High 161.85
Previous Weekly Low 159.51
Previous Monthly High 161.85
Previous Monthly Low 155.36
Daily Fibonacci 38.2% 160.32
Daily Fibonacci 61.8% 160.65
Daily Pivot Point S1 159.73
Daily Pivot Point S2 159.03
Daily Pivot Point S3 158.3
Daily Pivot Point R1 161.17
Daily Pivot Point R2 161.9
Daily Pivot Point R3 162.6


Share: Feed news

Information on these pages contains forward-looking statements that involve risks and uncertainties. Markets and instruments profiled on this page are for informational purposes only and should not in any way come across as a recommendation to buy or sell in these assets. You should do your own thorough research before making any investment decisions. FXStreet does not in any way guarantee that this information is free from mistakes, errors, or material misstatements. It also does not guarantee that this information is of a timely nature. Investing in Open Markets involves a great deal of risk, including the loss of all or a portion of your investment, as well as emotional distress. All risks, losses and costs associated with investing, including total loss of principal, are your responsibility. The views and opinions expressed in this article are those of the authors and do not necessarily reflect the official policy or position of FXStreet nor its advertisers. The author will not be held responsible for information that is found at the end of links posted on this page.

If not otherwise explicitly mentioned in the body of the article, at the time of writing, the author has no position in any stock mentioned in this article and no business relationship with any company mentioned. The author has not received compensation for writing this article, other than from FXStreet.

FXStreet and the author do not provide personalized recommendations. The author makes no representations as to the accuracy, completeness, or suitability of this information. FXStreet and the author will not be liable for any errors, omissions or any losses, injuries or damages arising from this information and its display or use. Errors and omissions excepted.

The author and FXStreet are not registered investment advisors and nothing in this article is intended to be investment advice.

Recommended content


Recommended content

Editors’ Picks

EUR/USD stays below 1.0700 ahead of US data

EUR/USD stays below 1.0700 ahead of US data

EUR/USD stays in a consolidation phase slightly below 1.0700 in the European session on Wednesday. Upbeat IFO sentiment data from Germany helps the Euro hold its ground as market focus shifts to US Durable Goods Orders data.

EUR/USD News

USD/JPY refreshes 34-year high, attacks 155.00 as intervention risks loom

USD/JPY refreshes 34-year high, attacks 155.00 as intervention risks loom

USD/JPY is renewing a multi-decade high, closing in on 155.00. Traders turn cautious on heightened risks of Japan's FX intervention. Broad US Dollar rebound aids the upside in the major. US Durable Goods data are next on tap. 

USD/JPY News

Gold manages to holds above $2,300

Gold manages to holds above $2,300

Gold struggles to stage a rebound following Monday's sharp decline but manages to hold above $2,300. The benchmark 10-year US Treasury bond yield stays in the green above 4.6% ahead of US data, not allowing XAU/USD to gain traction.

Gold News

Worldcoin looks set for comeback despite Nvidia’s 22% crash Premium

Worldcoin looks set for comeback despite Nvidia’s 22% crash

Worldcoin price is in a better position than last week's and shows signs of a potential comeback. This development occurs amid the sharp decline in the valuation of the popular GPU manufacturer Nvidia.

Read more

Three fundamentals for the week: US GDP, BoJ and the Fed's favorite inflation gauge stand out Premium

Three fundamentals for the week: US GDP, BoJ and the Fed's favorite inflation gauge stand out

While it is hard to predict when geopolitical news erupts, the level of tension is lower – allowing for key data to have its say. This week's US figures are set to shape the Federal Reserve's decision next week – and the Bank of Japan may struggle to halt the Yen's deterioration. 

Read more

Forex MAJORS

Cryptocurrencies

Signatures